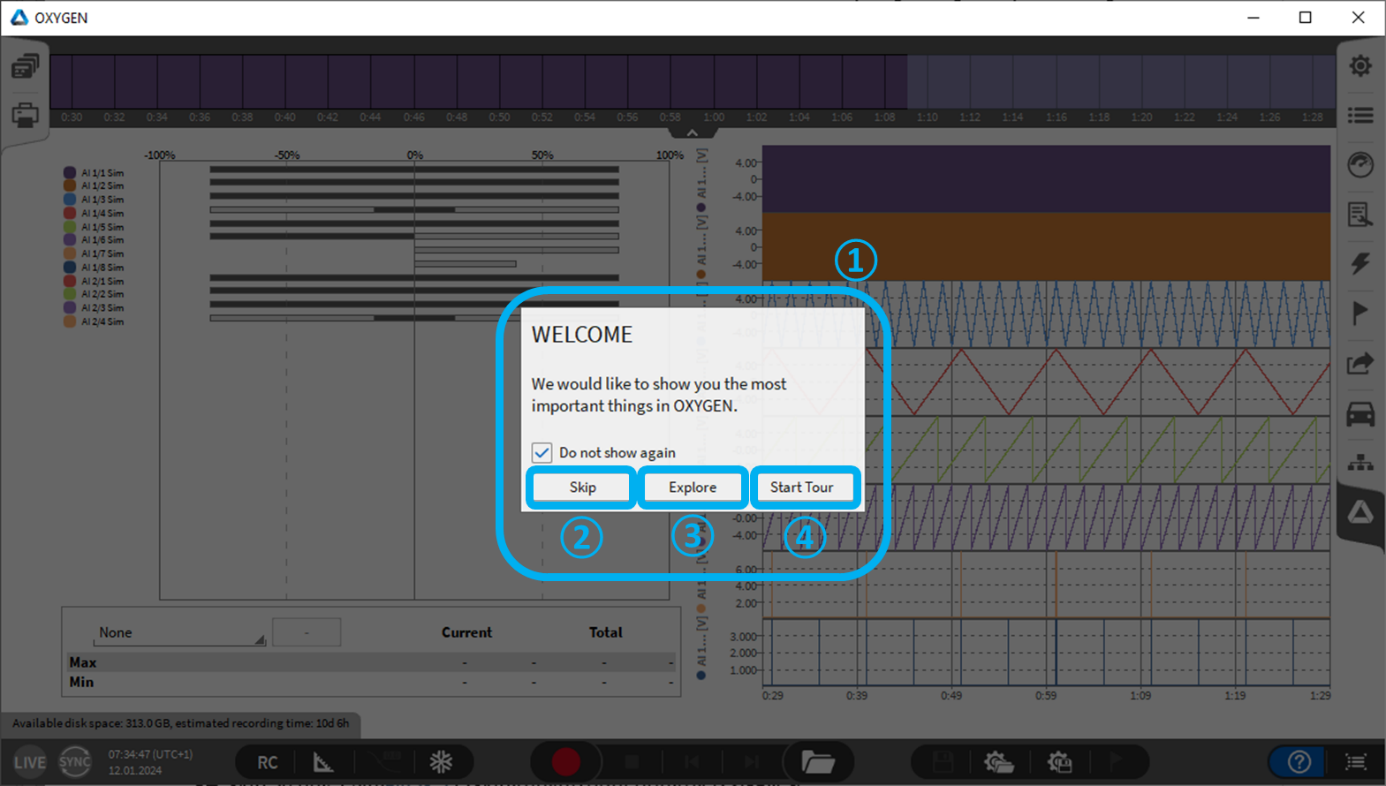
After the software has been started, a “Welcome Tour” will automatically begin to guide you through the basic functionalities of OXYGEN. For this purpose, a window appears at the beginning (see ① in Fig. 10).
You have the following options for the introduction to OXYGEN:
“Skip” (see ② in Fig. 10): Skip the introduction to OXYGEN.
“Explore” (see ③ in Fig. 10): The introduction is started. Now all available icons and buttons on the measurement screen are outlined in red. If you navigate with the mouse cursor over a bordered area, a short descriptive text about the function is displayed. Click on “x” (see ② in Fig. 11) to quit the introduction.
“Start tour” (see ④ in Fig. 10): Let yourself be guided through the various basic functions of OXYGEN. By clicking on “<<” or “>>” (see ① in Fig. 12) it is possible to jump through the individual icons, buttons and displays, the descriptions are automatically displayed for the respective area. By clicking on “x” (see ① in Fig. 12) you can quit the introduction.
After starting the software, the following screen will appear. OXYGEN will instantly start to acquire data but will not store it yet.
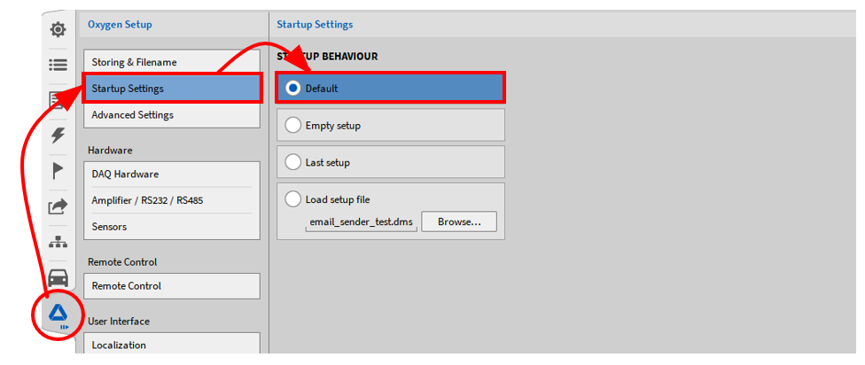
To activate the default measurement screen when OXYGEN will be started, the corresponding startup setting must be checked (see Fig. 13). This setting is activated per default, when starting OXYGEN the first time.
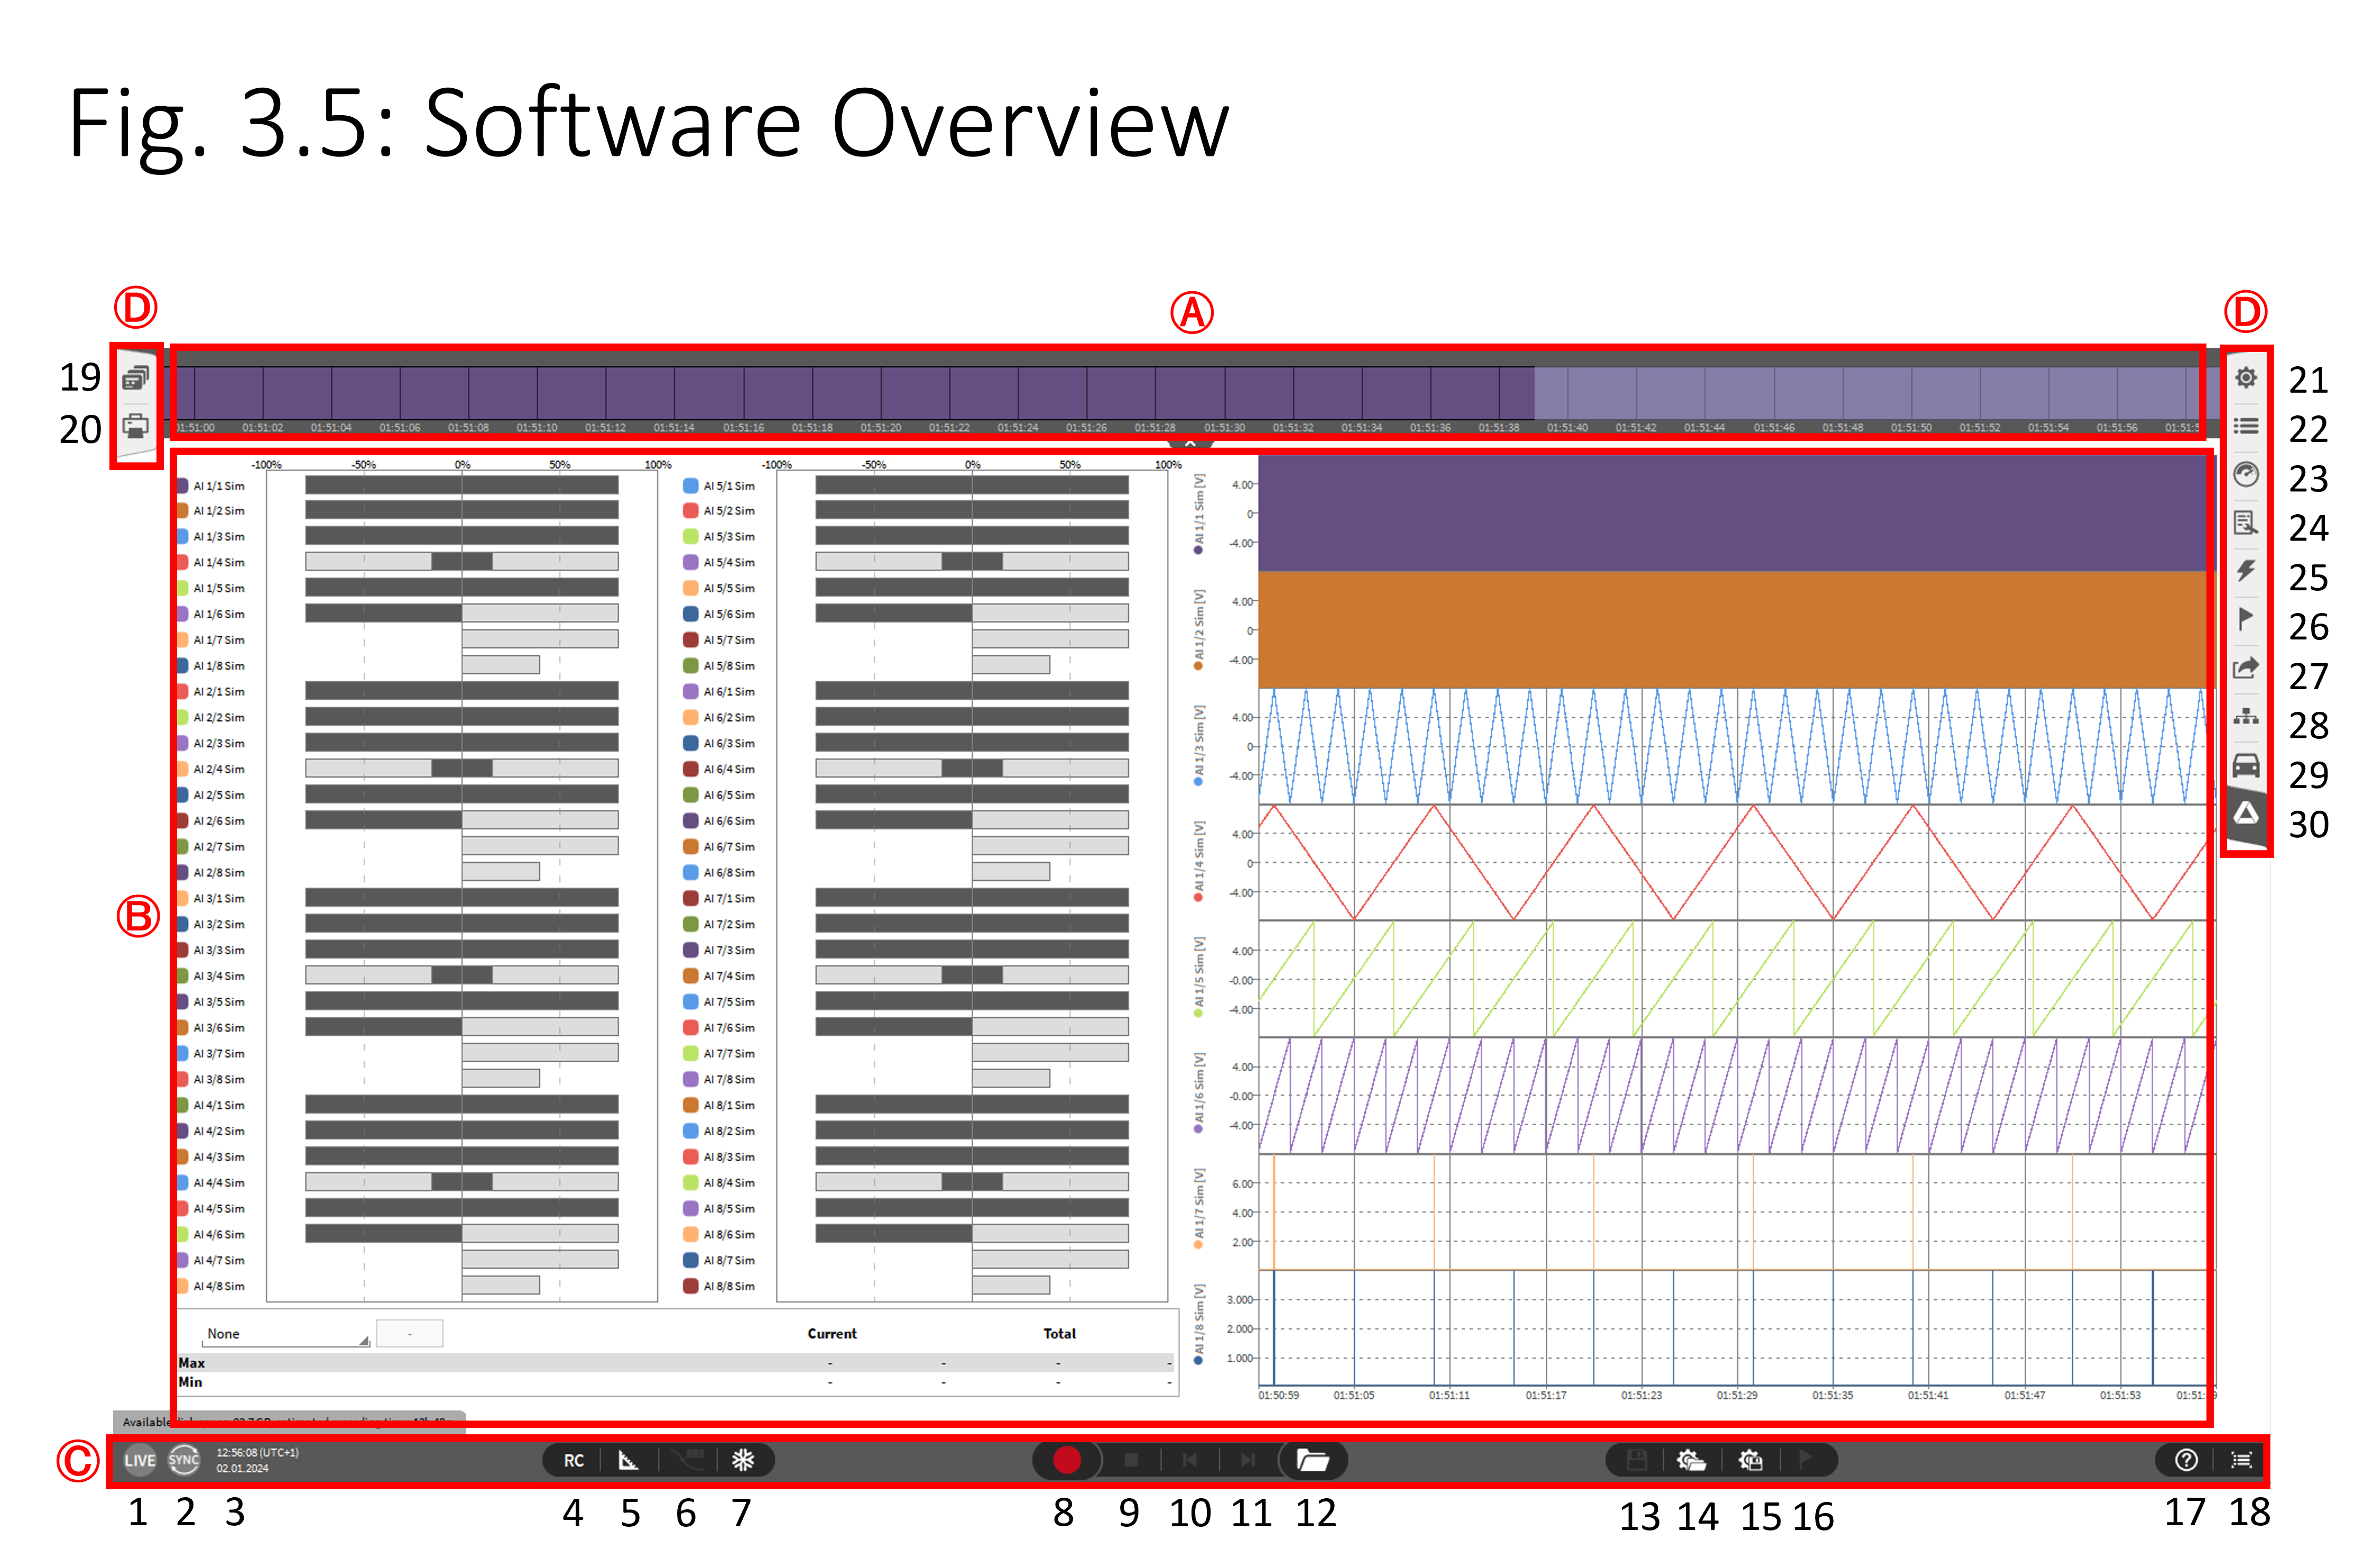
The saturation meter (Saturation meter) as well as a chart recorder instrument (see Recorder), displaying the first 8 analogue input channels, is part of the OXYGEN default measurement screen (see Fig. 14).
Fig. 13 Settings to activate automatic visualization of default measurement screen
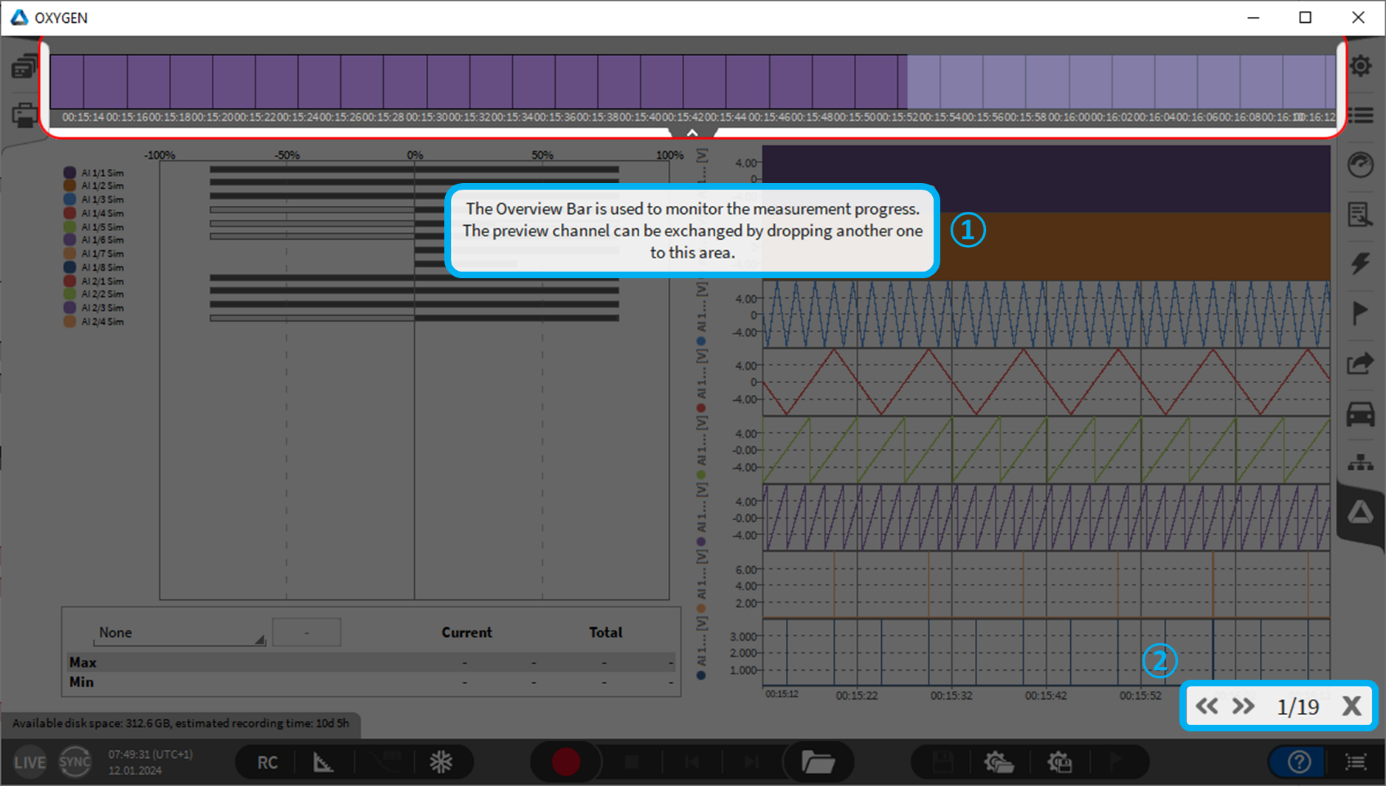
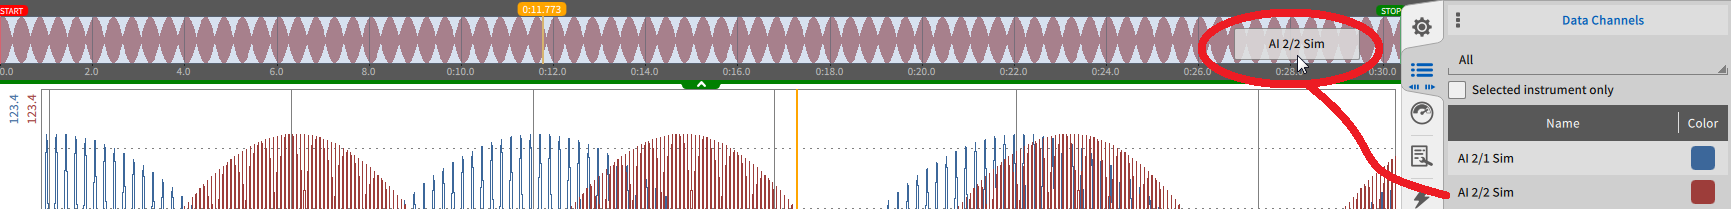
The Overview bar gives a rough overview about the measurement data. It displays the time dependent trend of one selected data channel. During the data review and analysis, the orange box shows the position of the currently displayed data in the measurement file (see Fig. 28). The user can change the displayed channel. Therefor he must open the Data Channels Menu and move the desired channel via drag and drop to the Overview bar (see Fig. 15).
Fig. 16 Change displayed channel in the Overview bar
Shows the time dependent trend of one selected input channel.
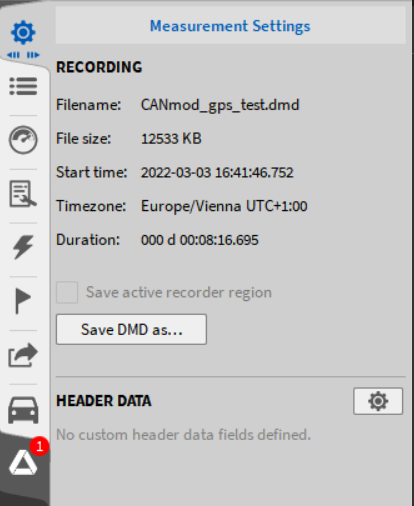
Stores changes to a data file that were made during analysis in the PLAY mode, whereas the file will be overwritten. To save the measurement file under a new name with the changes made, open the small Measurement Settings menu and click on Save DMD as… .
Activates the Design mode to manipulate the surface of the measurement screens and add, delete or change the Instruments on the screen. For detailed information refer to Adding an instrument to the measurement screen and channel assignment. With the middle mouse button, the Design Mode can be toggled.
Shows the current software indicator mode. OXYGEN has three different Operating Modes: LIVE, REC and PLAY. The actual software mode is displayed in the Action bar (see ① in Fig. 14). The properties of the different modes are explained in the following section:
LIVE mode: OXYGEN is only acquiring and displaying data but not storing it to a data file yet. This mode is active when OXYGEN is started, a measurement is stopped or when a data file is closed.
REC mode: OXYGEN is acquiring data and storing it to a data file. A red line above the Action bar indicates this mode. OXYGEN stores the data automatically to a data file. An explicit command for storing the acquired data to a file is not necessary. For changing the data storing settings, refer to General settings.
PLAY mode: Mode for reviewing, analyzing and exporting data. This mode is activated after a data file was loaded. A green line above the Action bar indicates this mode.
Opens the properties of a||| selected Instrument; for detailed information refer to Instruments and instrument properties. The Instrument Properties can also be opened with a double click on the desired instrument.
This chapter explains the difference between online and offline data processing. As explained in Action bar, there are three different operating modes: LIVE, REC and PLAY mode.
All the data processing, which is done and configured in the LIVE mode is called online data processing. OXYGEN is acquiring data, formula channels etc. can be created and will be saved in the setup, but no data has yet been recorded. These channels cannot be deleted in the post-processing.
All the data processing, which is done after a recording in the post-processing is called offline data processing. When reviewing a measurement file OXYGEN is opened in PLAY mode. That is the mode for reviewing, analyzing, and exporting data. These channels can be deleted until the file is closed the first until upon creating the channels. The channels will not be saved in the setup, unless a new setup file is created from the measurement file (see ⑤ in Fig. 27).
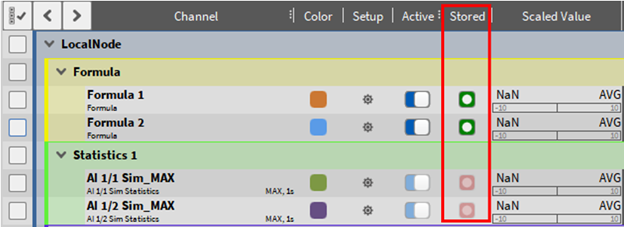
The difference for an online and offline created channel, can also be seen in the different colored Stored indicator in the channel list. This indicator is red for online created channels and green for offline created channels. As seen in Fig. 19, both statistics channels were created before the recording was started, therefore in the LIVE mode of OXYGEN. The two formula channels were created after the recording, when the file was opened again in OXYGEN.
Fig. 19 Different colored stored indicator for online and offline created channels
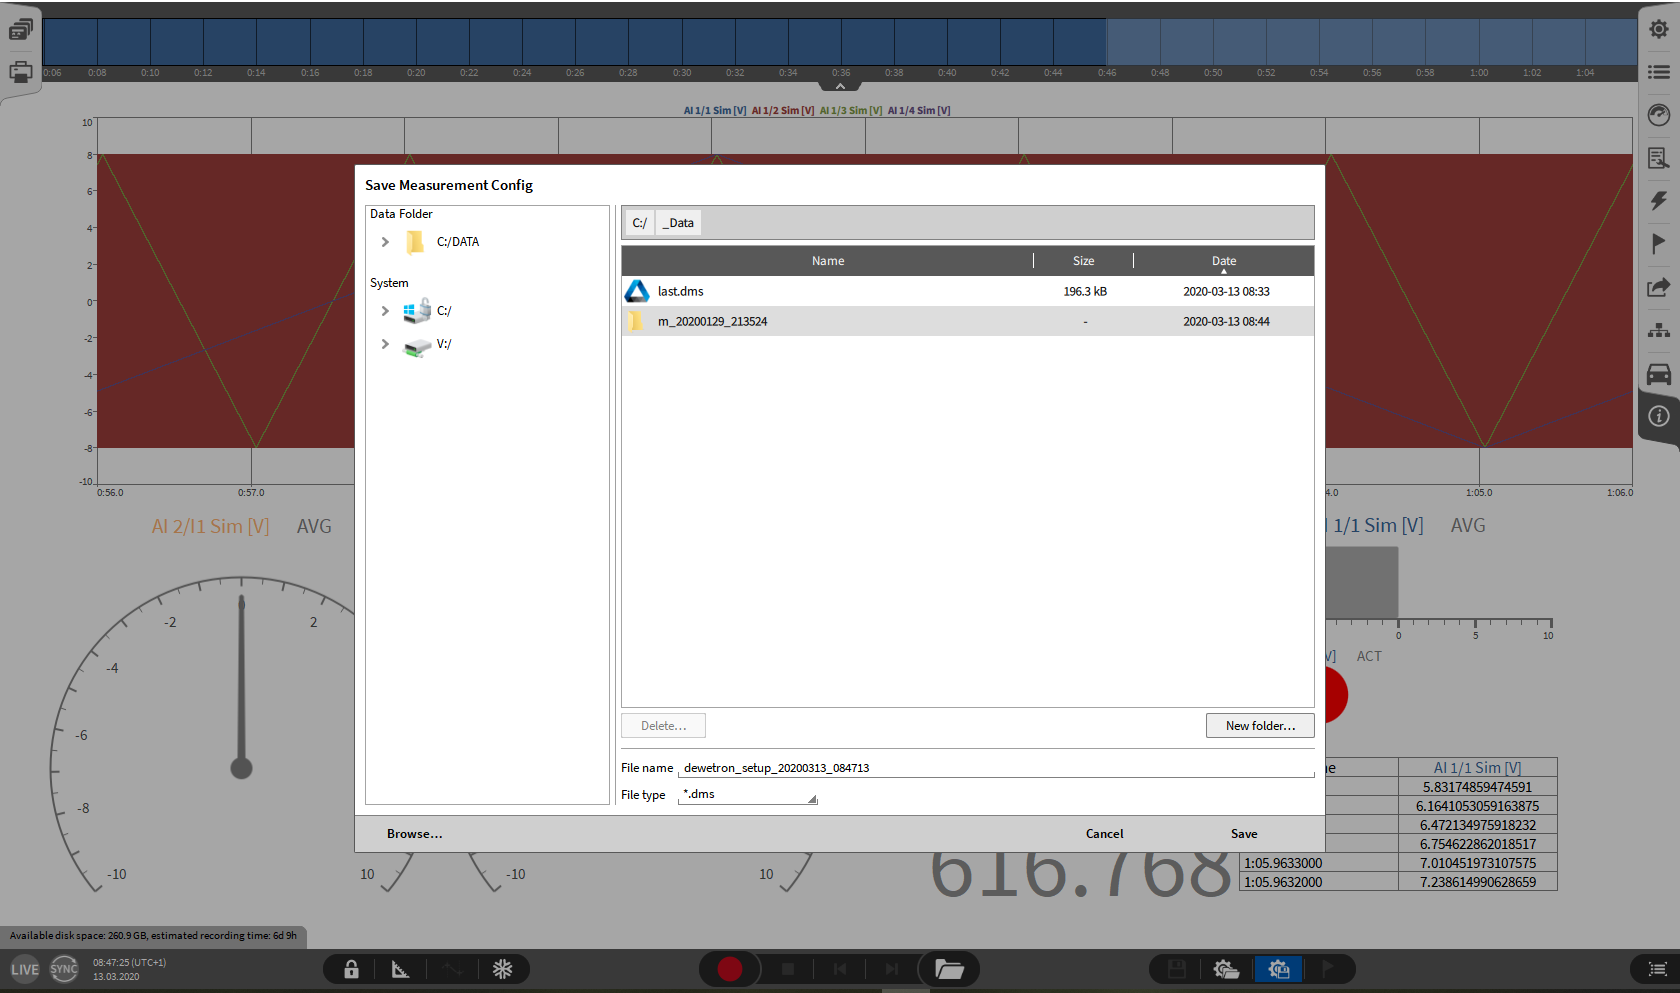
Touch or left click the gear and folder icon along the bottom tool bar (see Fig. 21 ⑭ in Fig. 14)
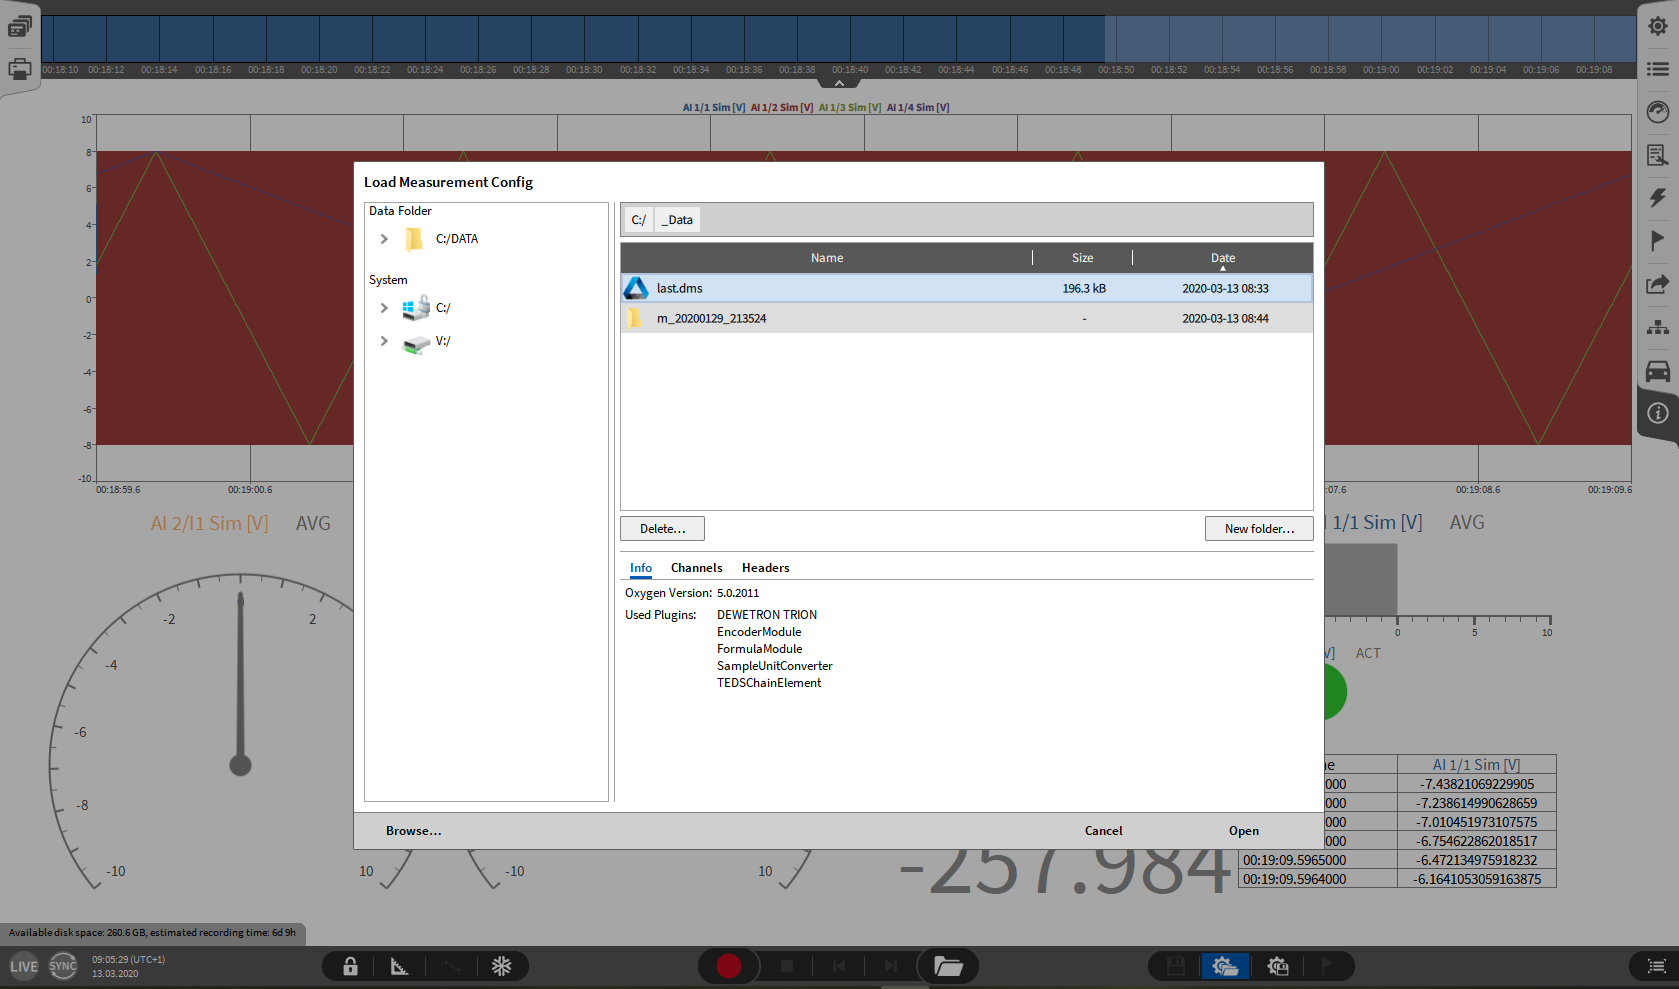
Upon selecting this icon, a Load Measurement Config dialog will appear
Within this dialog, the user can select the Measurement Setup he would like to open. Info, Channels and Headers contain additional information about the file to ease the search for the correct file.
By clicking on the Browse button, the Windows Explorer dialog will open to more easily browse another folder location
The Open button will open the selected Setup file
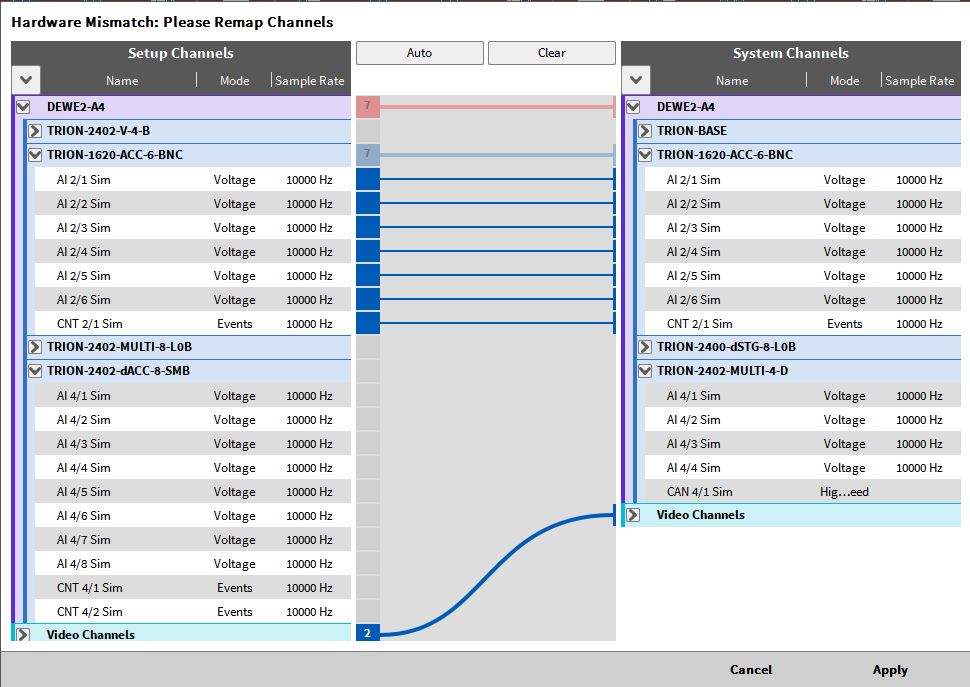
If the measurement hardware does not match with the hardware stored in the setup file, the Hardware Match dialog will open (see Fig. 22). Within this dialog, the user can rematch his connected hardware to the hardware stored in the setup file before opening it. Identical TRION modules will be matched automatically or use the Auto button (see Fig. 22). Clicking on Clear will delete the complete match that is done so far. After connecting all necessary channels, the user can click on Apply and the setup loading will be continued.
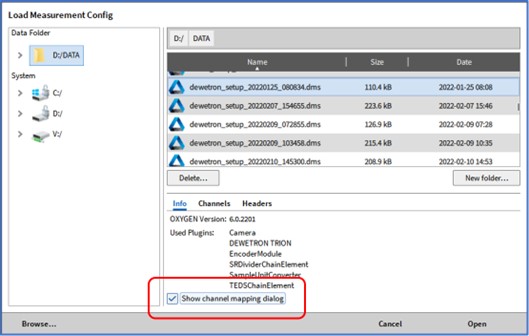
The hardware Mismatch dialog can also be forced to show up, even if the actual hardware matches the hardware in the setup. This is possible by selecting the Show channel mapping dialog, when opening an OXYGEN Setup (see Fig. 23)
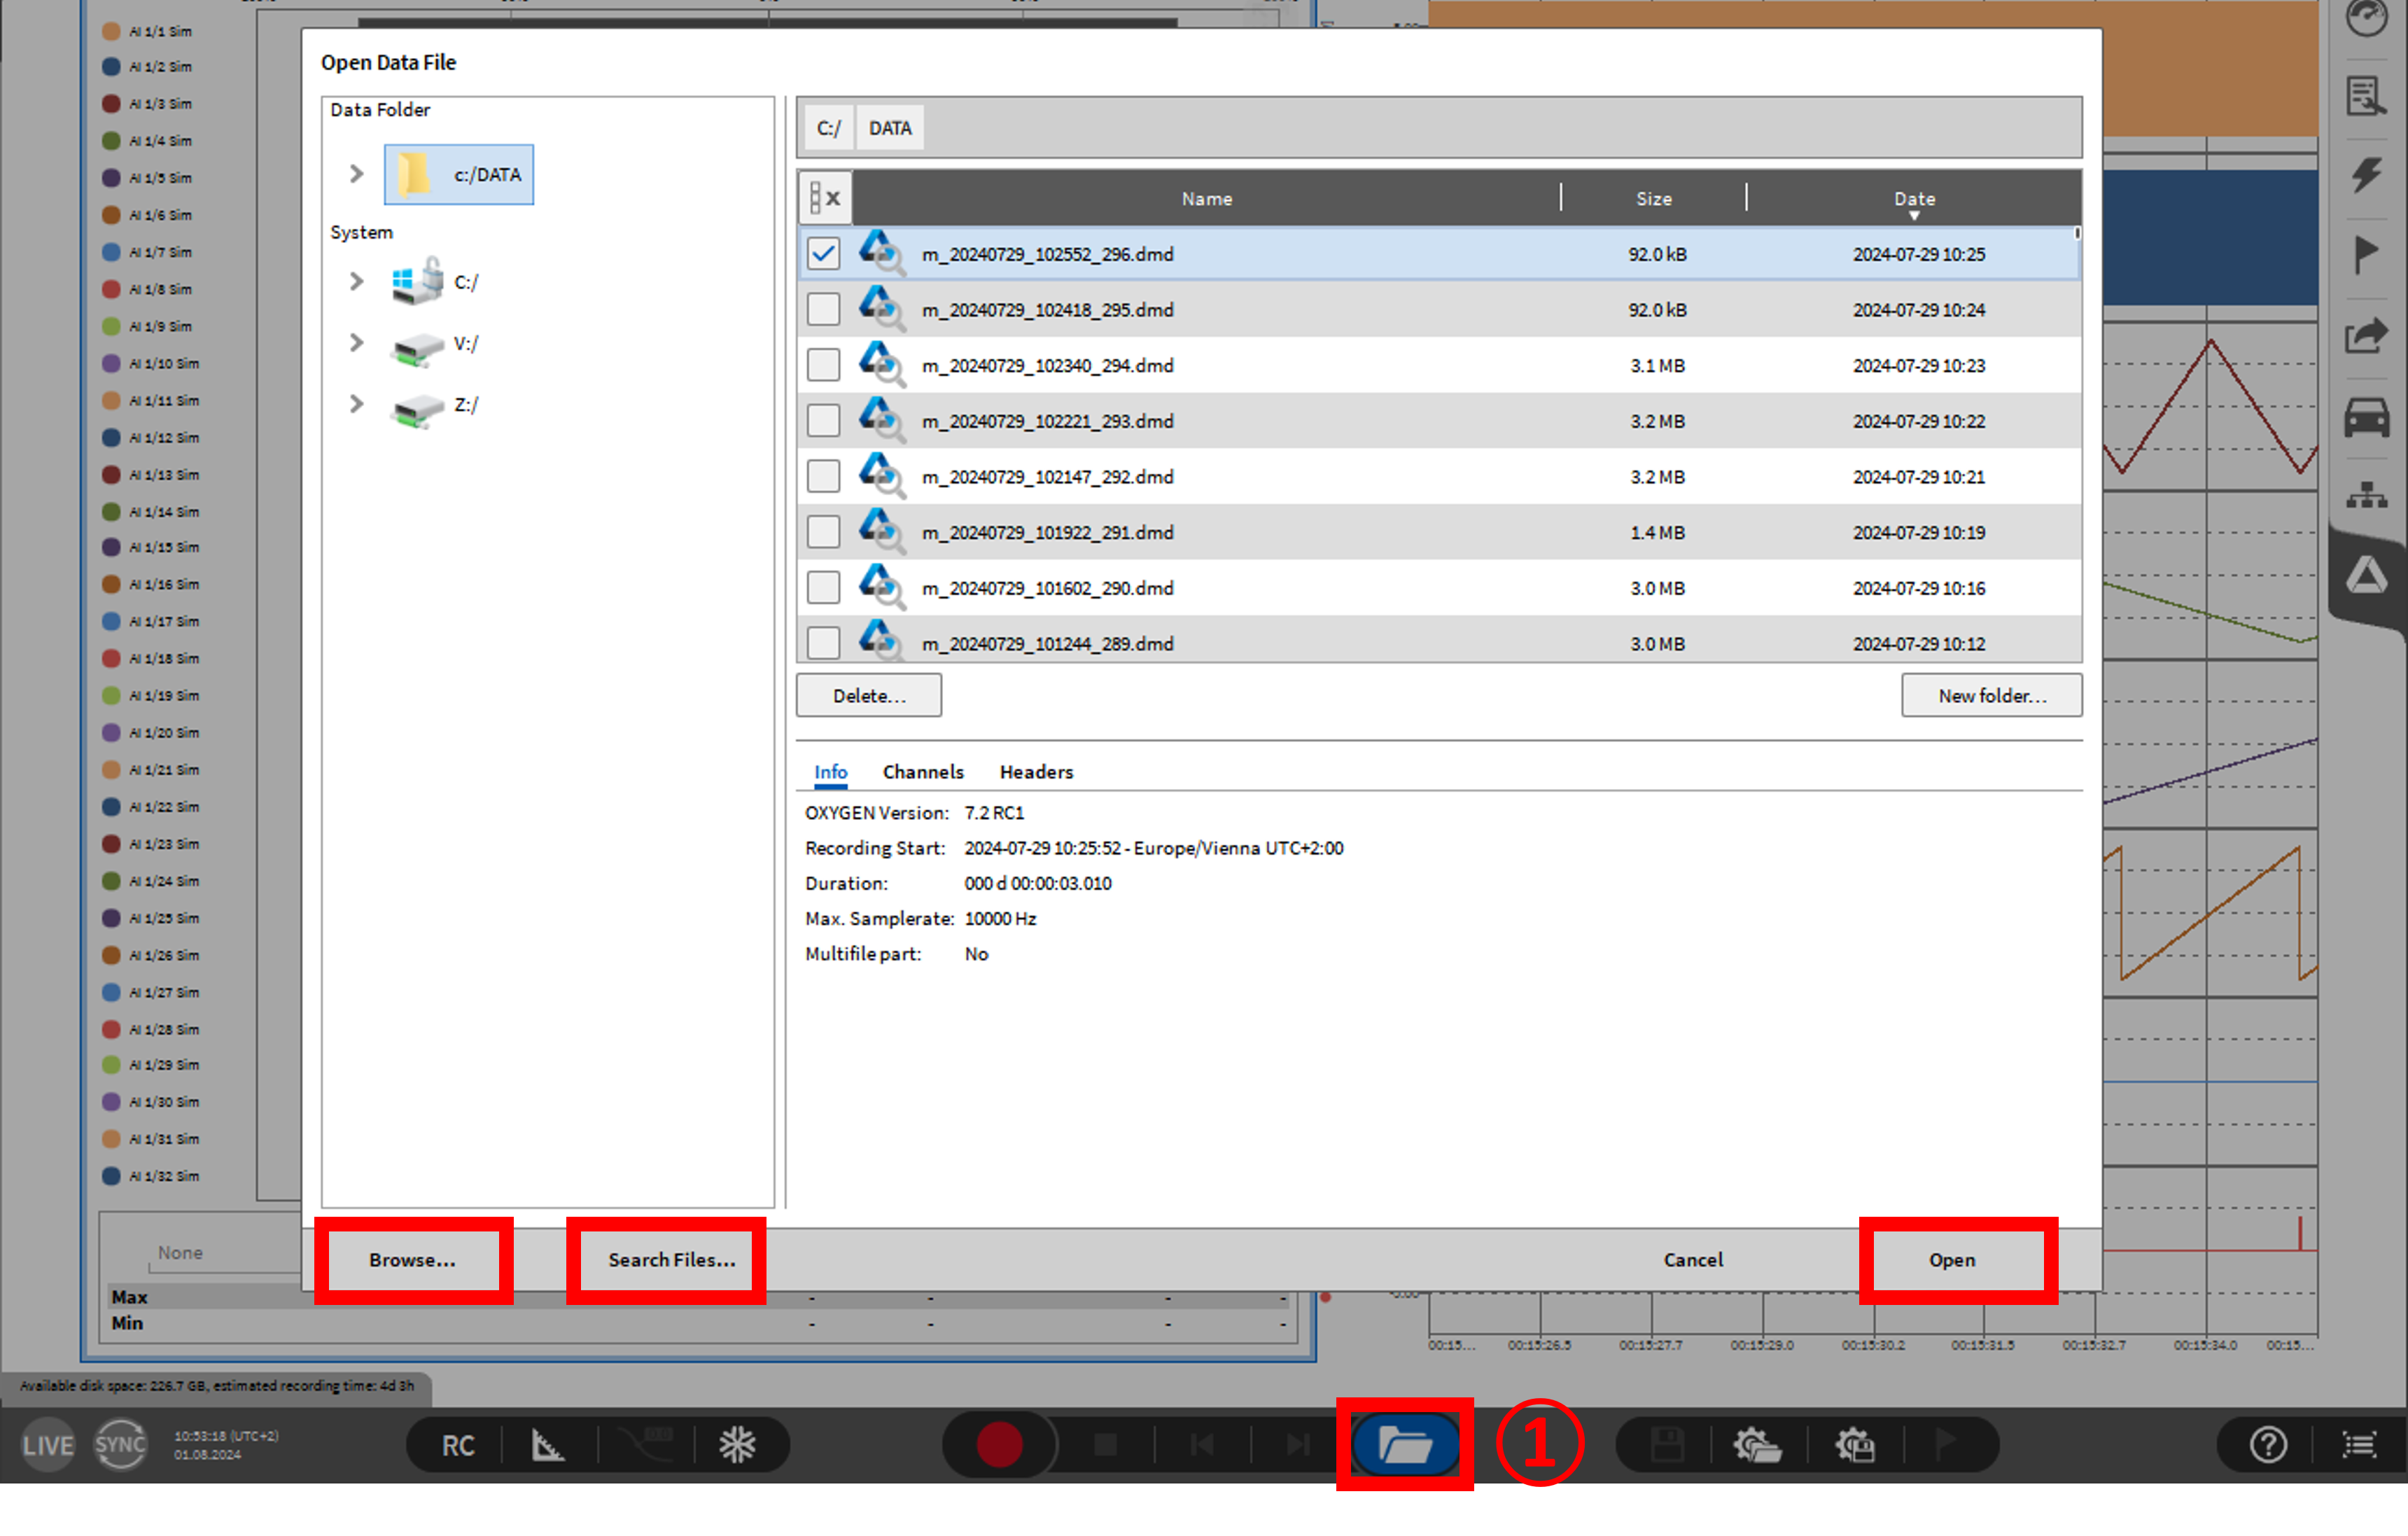
Touch or left click the folder icon in the Action bar (see ① Fig. 24 or ⑫ in Fig. 14)
Upon selecting this icon, an Open Data File dialog will appear.
Select the appropriate Data Folder on the left side of the menu.
Once the Data Folder is found, the Data file list will be populated with *.dmd Data files showing their name, size, and date of recording.
Within this dialog, the user can select the Data file he would like to open. Info, Channels and Headers contain additional information about the file to ease the search for the correct file.
By clicking on the “Browse…” button the Windows Explorer dialog will open to browse the right Data Folder.
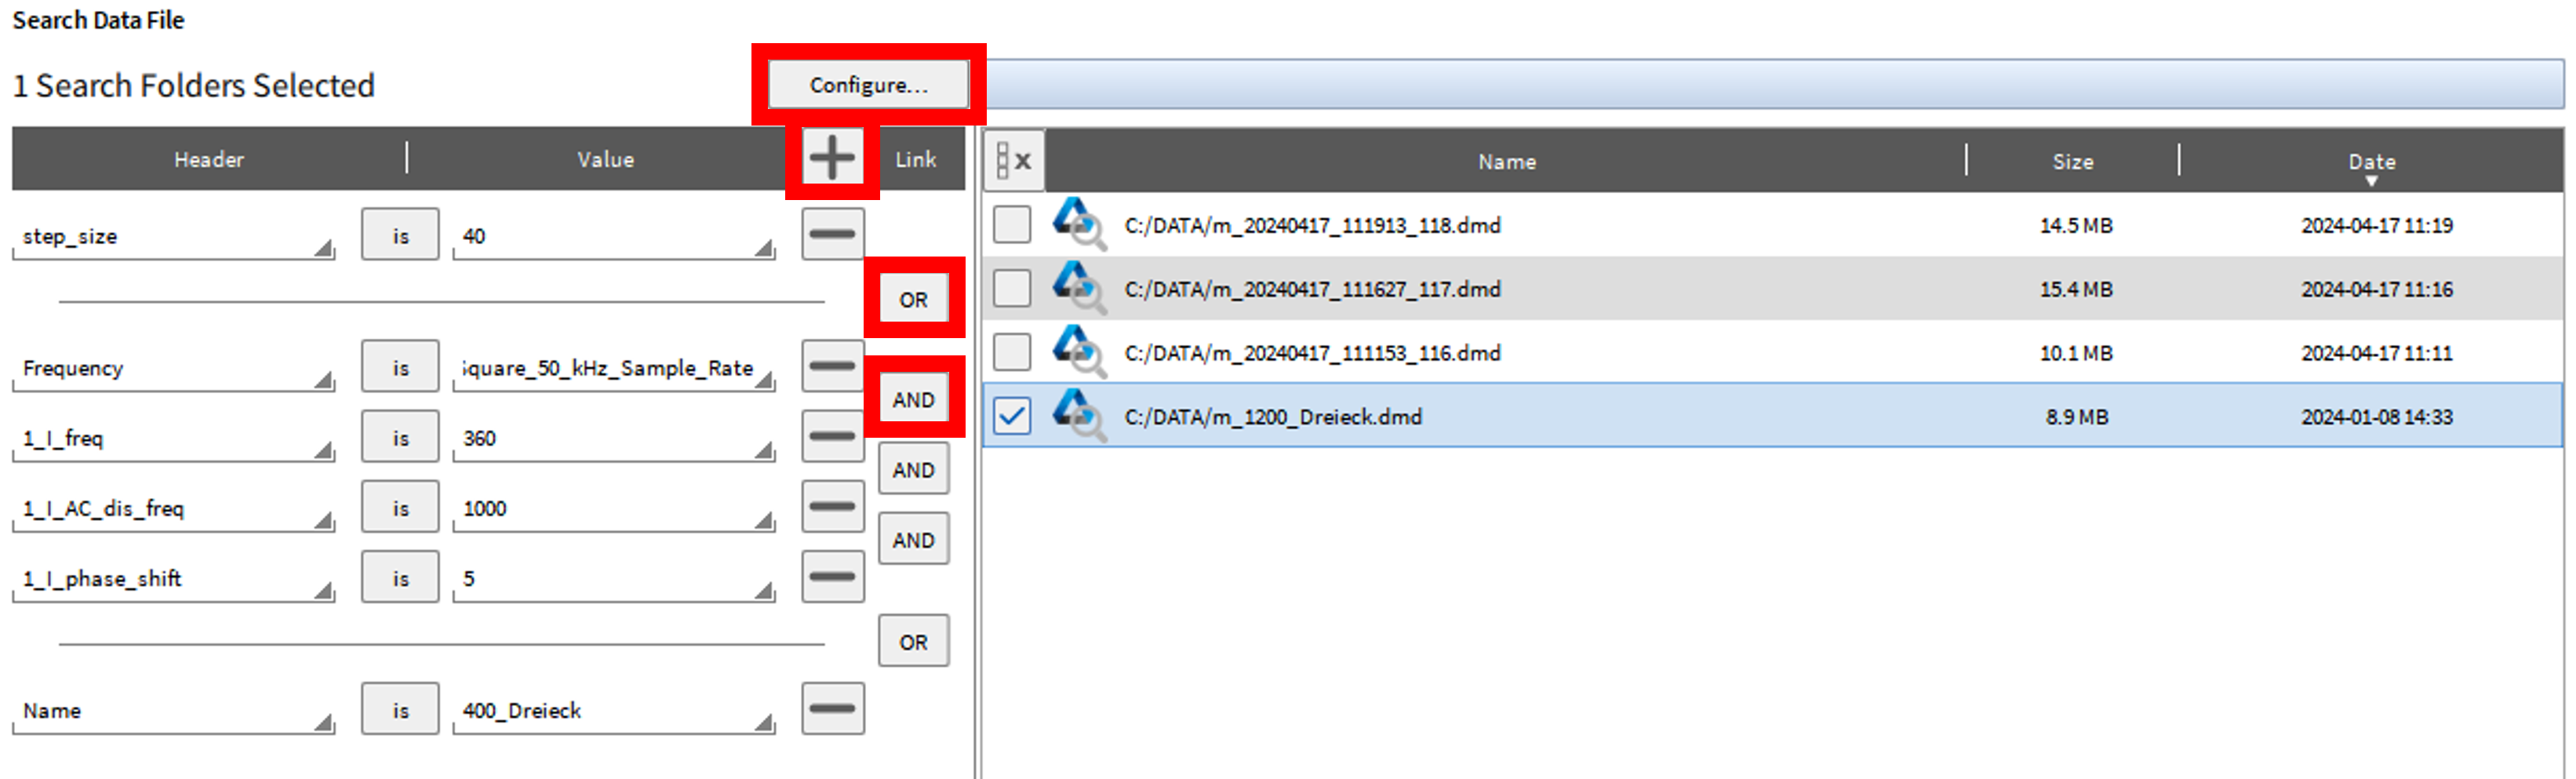
The “Search Files…” button will open a dialog window enabling to filter the data files by AND, OR conditions. The conditions cannot be used sequentially. To switch from AND to OR, simply click on the AND (see Fig. 25).
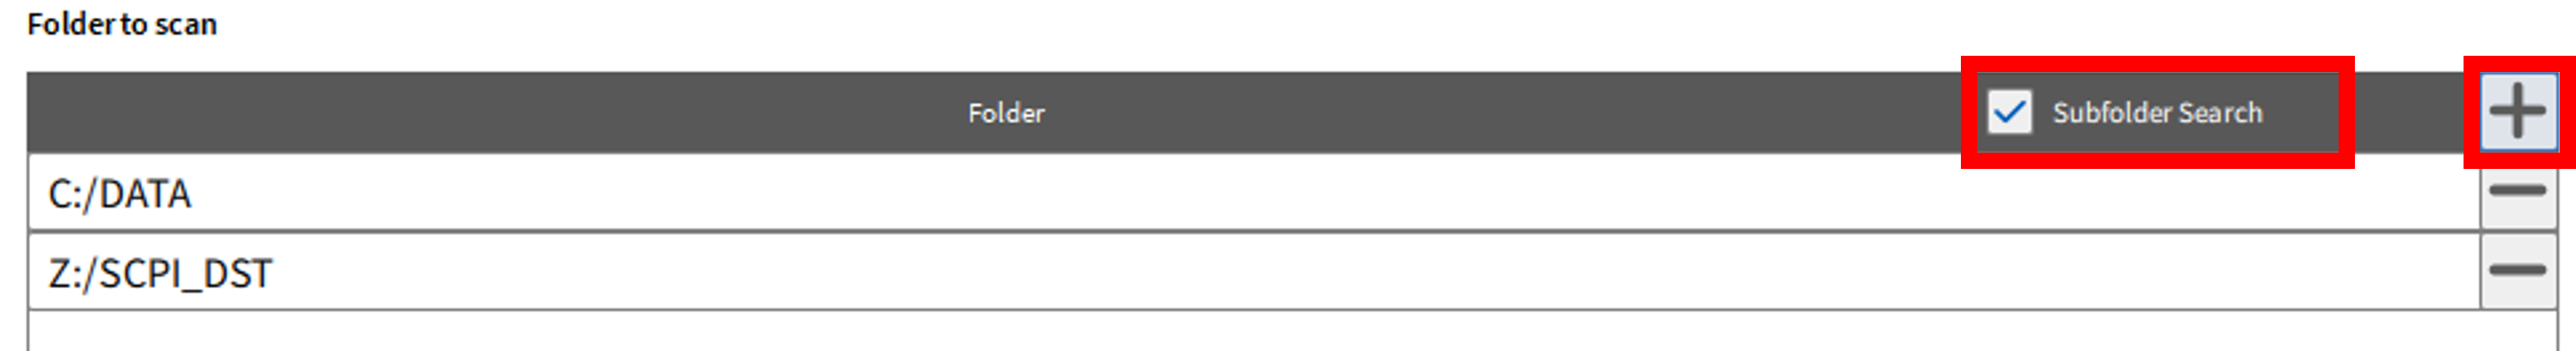
The “Configure…” button enables to specify additional folders via to scan and whether subfolders are scanned for data files (see Fig. 26).
Fig. 26 Configure folder and optional subfolder to scan
The Open button will open the selected Setup file (see Fig. 24).
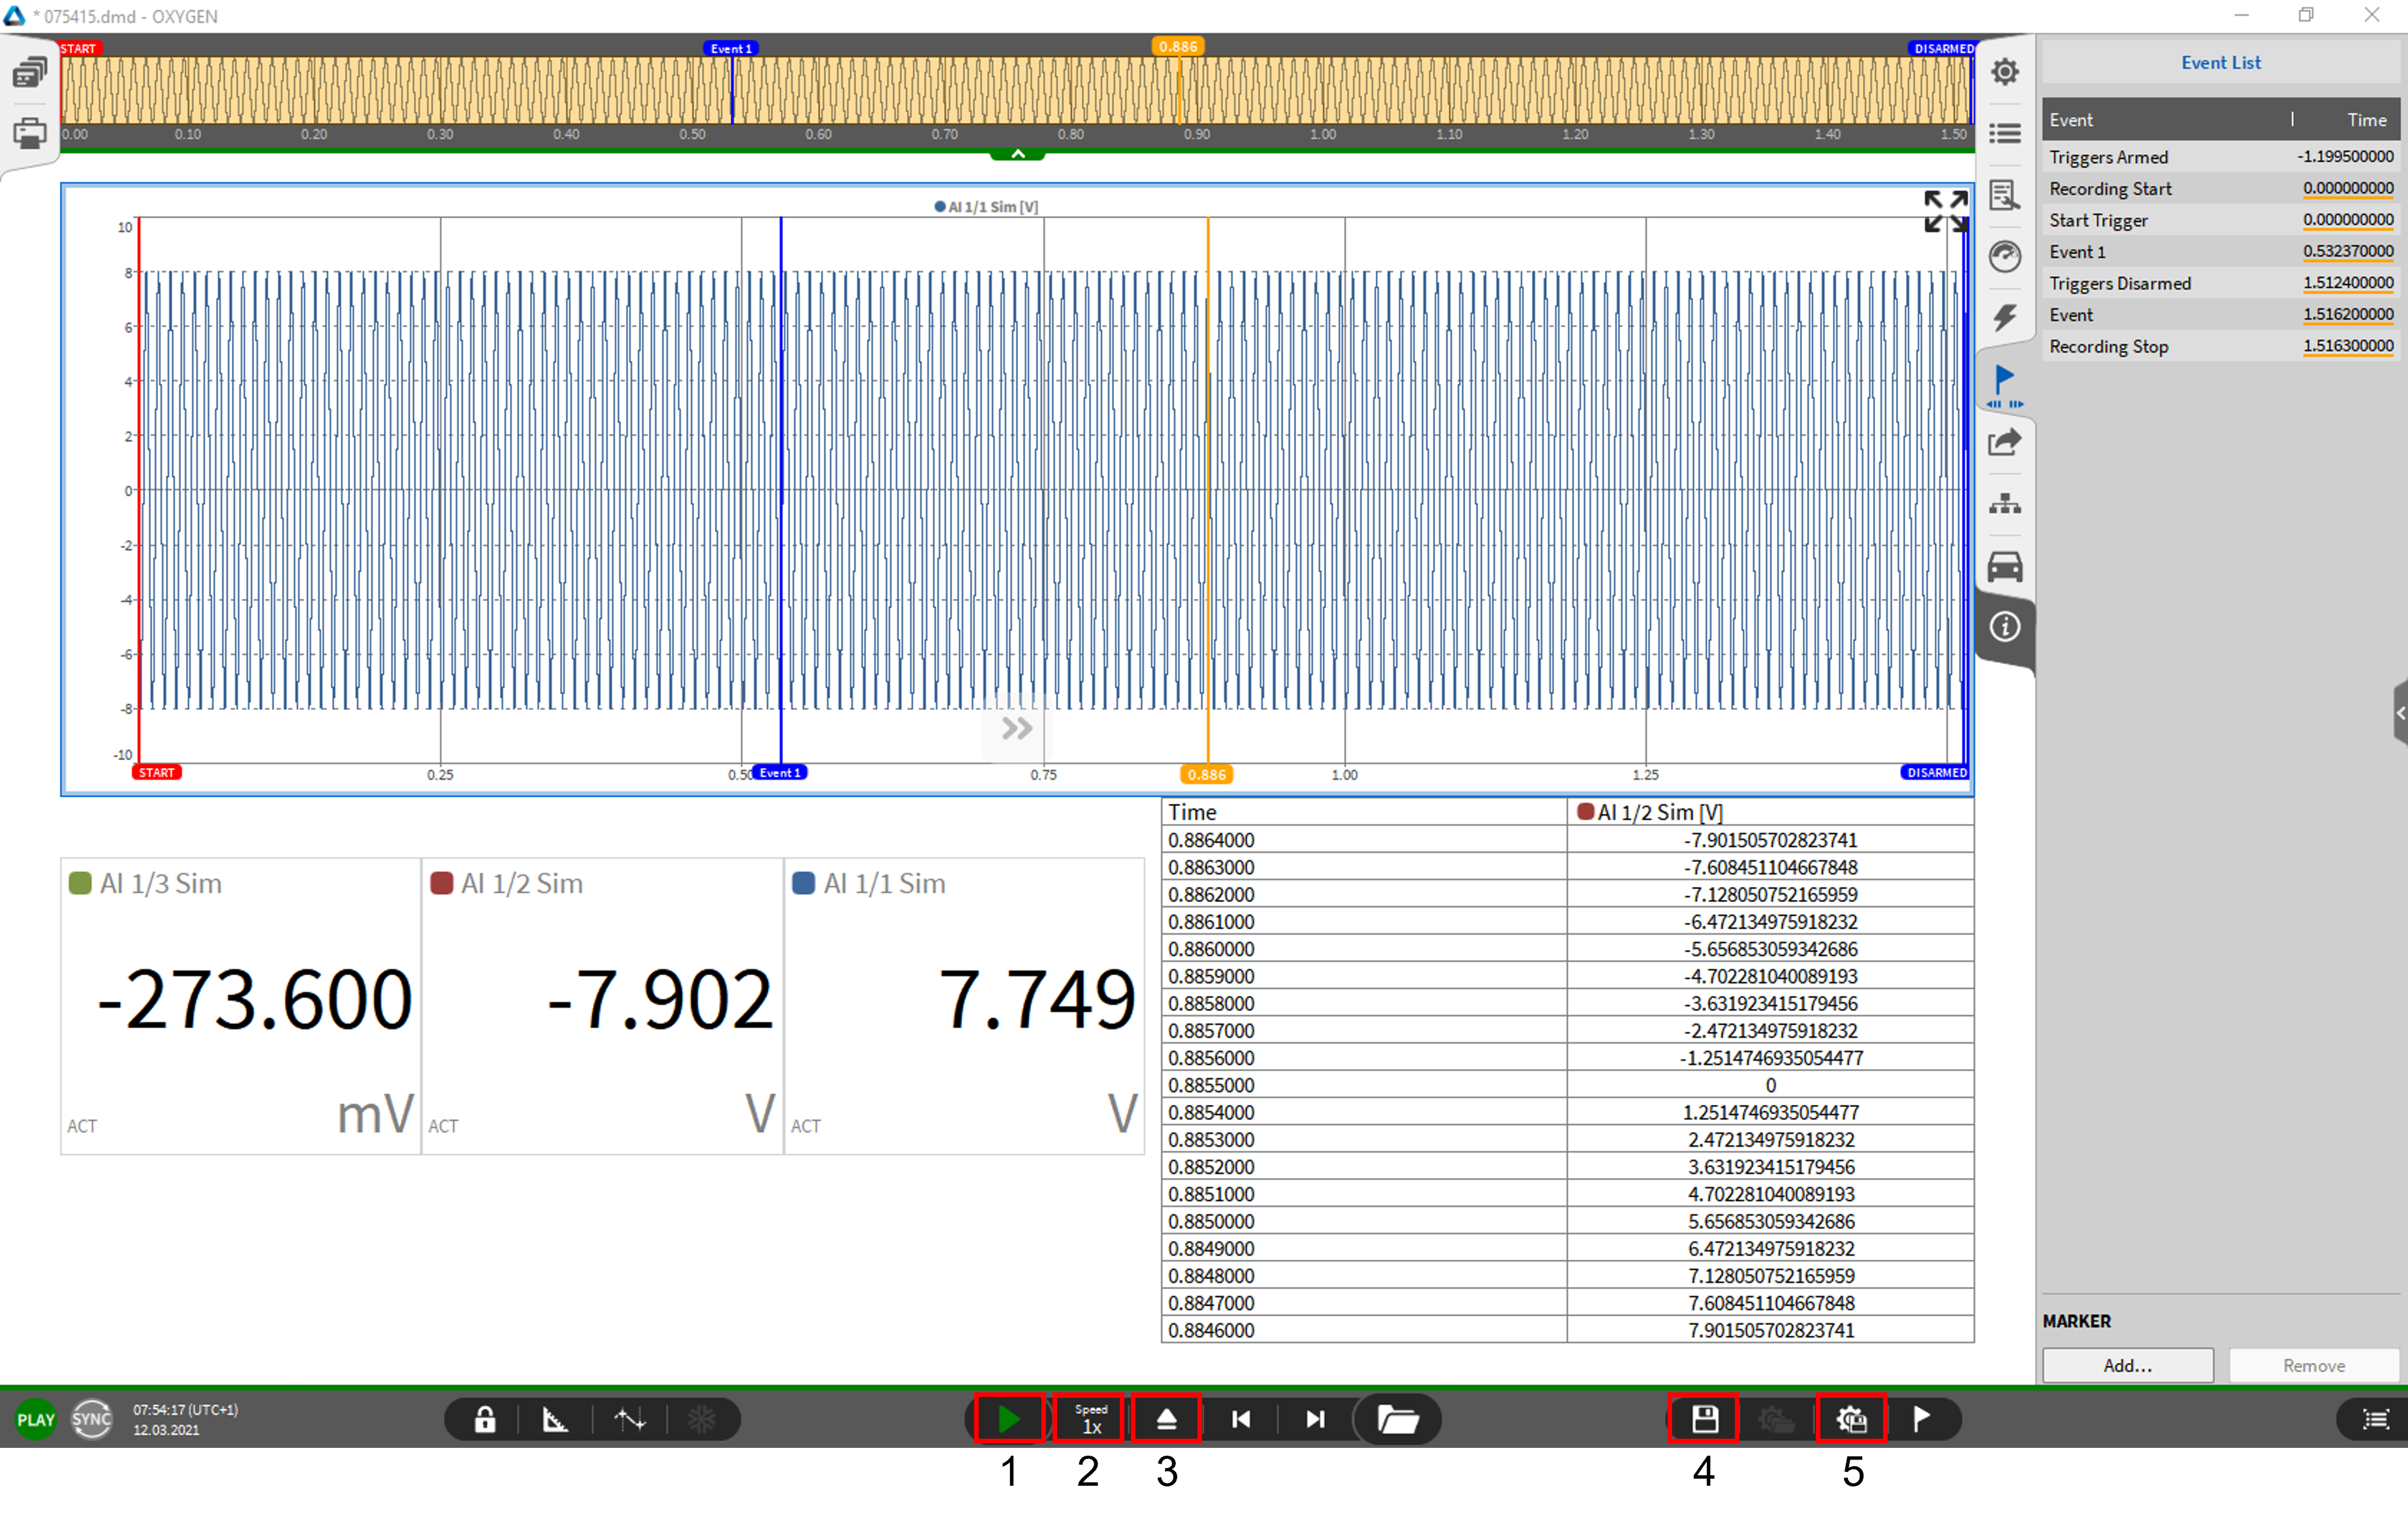
Along the top of the newly opened data file lies the Overview Bar (see Fig. 27 or Ⓐ in Fig. 14). The Overview Bar displays the events that have taken place during this measurement. Such as: start, pause, resume, current playback time position, and termination of recording.
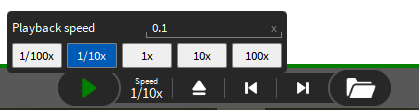
Once the user clicks the green PLAY button (see ① Fig. 27) at the bottom of the screen the yellow playback position cursor will stream across the screen and the displays currently on the screen will then become active, displaying the data currently seen at that playback position.
The playback speed can be changed by clicking on the Speed button (see ② Fig. 27 or Fig. 28). Select a speed from the shown buttons or enter an individual value in the field between 1000x to 1/1000x. Note: Audio replay only working with a playback speed of 1x (original speed).
Once finished reviewing the data file, save the file by clicking on the save button in the action bar or save the file with a new name by opening the small measurement settings menu and click on Save DMD as. Select then the Eject button (see ③ in Fig. 27) which is located to the right of the Speed button. If you do not want to save the data file, only click on the Eject button and select Discard in the pop-up window. After that OXYGEN will be in LIVE mode again and start to acquire data.
A Recorder instrument is very useful during playback, because it also allows you to see all the different events that may have happened during a measurement
The Event List menu (see Fig. 27) will clearly display all events and the points of time the events occurred in a list. For adding a marker to an event, refer to Event List.
Changes that were applied to the data file during the analysis can be saved to the data file by pressing the diskette-button (see ④ in Fig. 27).
A setup file based on the settings of a data file can be created by pressing the gear-diskette-button (see ⑤ in Fig. 27).
OXYGEN allows the user to customize his experience within the software. Users can re-order the menu selection panels on the opposing side bar. This allows the user to have multiple menus open at the same time. To change the order, the user can select the respective menu and must keep the mouse button pressed for one second. Then a blue background on the menu sign will appear. Now the user can move the menu to the desired position while keeping the button pressed. It is also possible to move a menu from the right sidebar to the left sidebar and vice versa.
Note
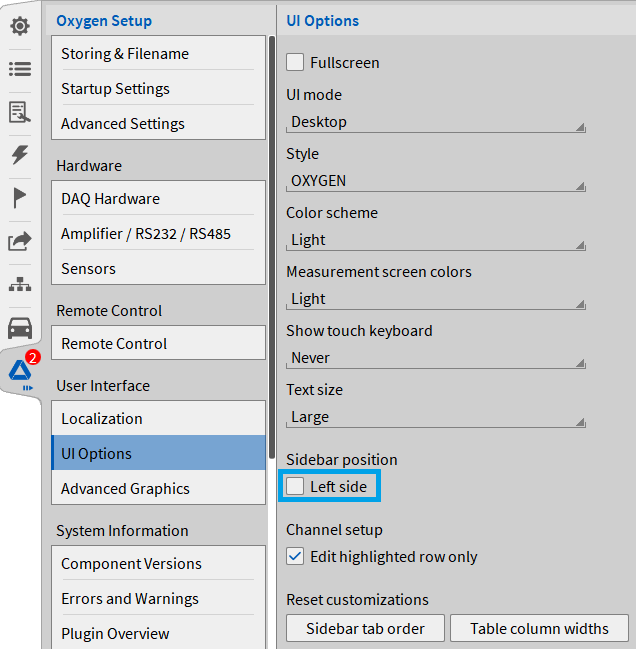
The user may find it difficult to place the menus back in the default order once a change has been made. To reset the position of your menus, head into OXYGEN Setup > UI Options and select the Reset button found under the Sidebar position section (see ① in Fig. 29).
The user can also swap the right and the left sidebar. To do so, head again into OXYGEN Setup > UI Options and select Left side under the Sidebar position (see ② in Fig. 29).
The user can also change the width of the menu sidebar.
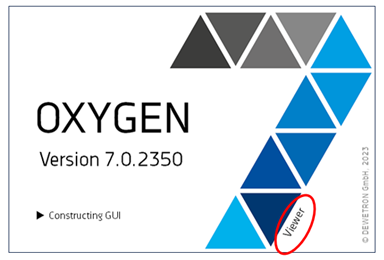
When a measurement file is opened, it is loaded using OXYGEN Viewer. Several OXYGEN Viewers can be open in parallel with one OXYGEN instance. To open a measurement file, simply double-click on it, and the splash screen with the addition “Viewer” will open, as shown in Fig. 30.
The core feature of recording data is only available with the main OXYGEN window, nonetheless, all other features like the post-processing features are also available in the Viewer Mode. Also, during recording this mode can be used to look at an already recorded datafile by opening it in the Viewer Mode.
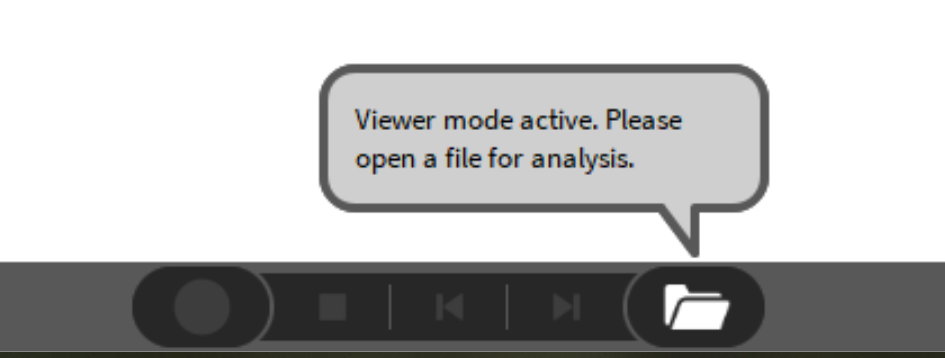
If a datafile is opened in Viewer Mode and ejected again (see ② in Fig. 27), a notice appears above the Action Bar shown in Fig. 31. Another datafile can be opened to analyze and review.