Voltage Fluctuation and Flicker Emission Analysis Reference (OPT-POWER-ADV)
This chapter describes the measurement parameters according to IEC61000-4-15 and IEC61400-21 Section 7.3. For the Flicker Reporting Table in the Power Instrument see Power Instrument.
Introduction
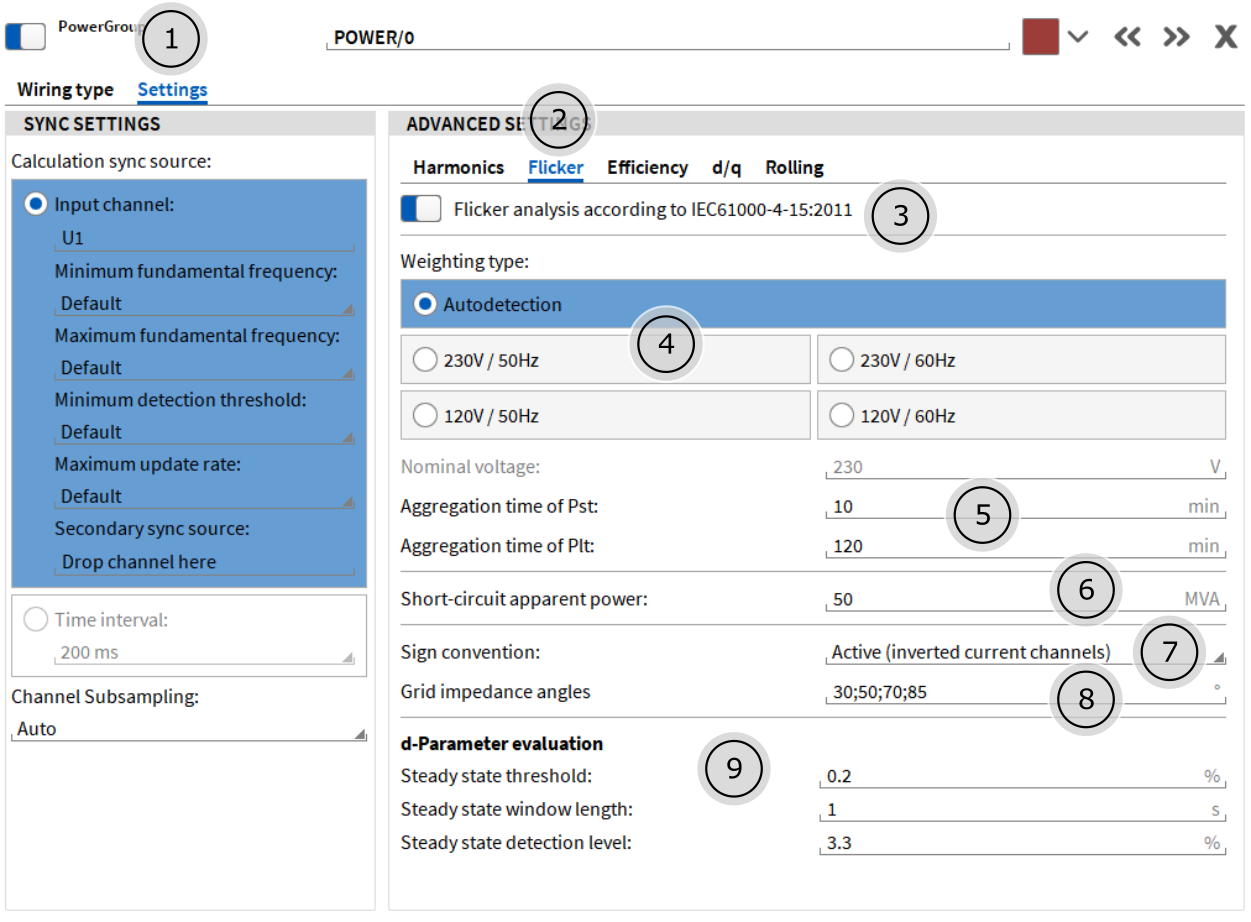
Fig. 48 Voltage Fluctuation Settings
Power Group’s Settings Tab
Details Tab for Settings of the Voltage Fluctuation Analysis
Enable/Disable Voltage Fluctuation Analysis
Selector for Weighting Type
- Input Field for Nominal Voltage, if weighting type is other than Autodetection;Input Field for Short Term (Pst) and Long Term (Plt) Voltage Fluctuation Aggregation time
Input Field for Short-Circuit Apparent Power
 for Flicker Emission evaluation. This value has to be inserted as single phase value.
- Sign convention (Passive / Active).In passive sign convention loads have positive power and sources have negative power. In active sign convention loads have negative power and sources have positive power.Use active when measuring positive real power on a generator.Use passive when measuring negative real power on a generator.
Grid impedance angles
d-Parameters
The grid impedance angles is an array with multiple values, separated by a semicolon. This angle gives the relation between ohmic and inductive behavior of the fictious grid. For more details about the fictous grid, see section Flicker Emission
The d-Paramaters can be manually defined to set the conditions of detected short term voltage fluctuations. For more details about the d-Parameters, see Short Term Voltage Fluctuations / d-Parameter.
Attention
Fundamental Frequency |
10 to 1000 Hz |
Nominal Voltage |
> 5% of Input Range |
Weighting Functions |
120V/50Hz, 120V/60Hz, 230V/50Hz, 230V/60Hz |
Aggregation Time Pst |
1 s to 60 min |
Aggregation Time Plt |
1 s to 1440 min |
Short Circuit Apparent Power |
0.001 to 10 000 MVA |
Perform Analysis
To perform a Voltage Fluctuation Analysis, please proceed the following Steps:
Switch on the Feature 2.
Select the Weighting Type 3 for your Application. Use Autodetection in low voltage grids (120V/230V). If you want to use the Voltage Fluctuation Algorithm outside these Conditions, please select the weighting type manually and insert the nominal voltage in 4.
Change the Aggregation Time of Pst and Plt if needed 5 + 6.
Change the sign convention to active if necessary 7.
Go back to Measurement Screen, take an indicator instrument and assign the U[i]_fluc_ready Channel.
Take a Table Instrument and assign the U[i]_fluc_Pst Channels or any other Instrument to visualize the Voltage Fluctuation Values.
Wait for Channel Ready (1 or red).
Start the Recording.
Flicker Emission
Flicker Emission is the Analysis of the virtually generated voltage fluctuation caused by the emitted current. This analysis procedure is described in the IEC61400-21 Standard. It uses a fictitious grid for simulation of a fictitious voltage, which is then processed with the flicker algorithm to get the Pst,fic.
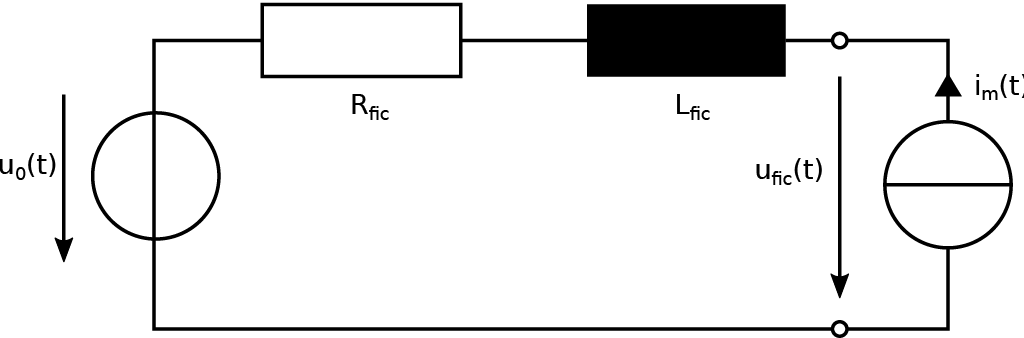
Fig. 49 Fictitious grid for simulation of fictitious voltage
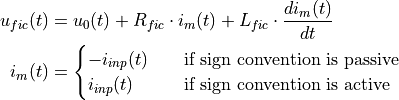

Calculation Insights
Symbol |
Description |
|---|---|
|
This is the short circuit power of the fictitious grid. To be given for one phase in MVA! |
|
Nominal Voltage |
|
Phase Angle of the Grid Impedance (pre-defined with 30/50/70/85 deg) |
|
Fictitious Ohmic Impedance |
|
Fictitious Reactive Impedance |
|
Nominal Frequency (50 or 60 Hz, depending on the selected Weighting) |


 of the analyzed grid


Short Term Voltage Fluctuations / d-Parameter
This functionality evaluates the voltage change characteristics according to IEC61000-4-15. For this analysis, the half-period rms values from the voltage channels are calculated internally.
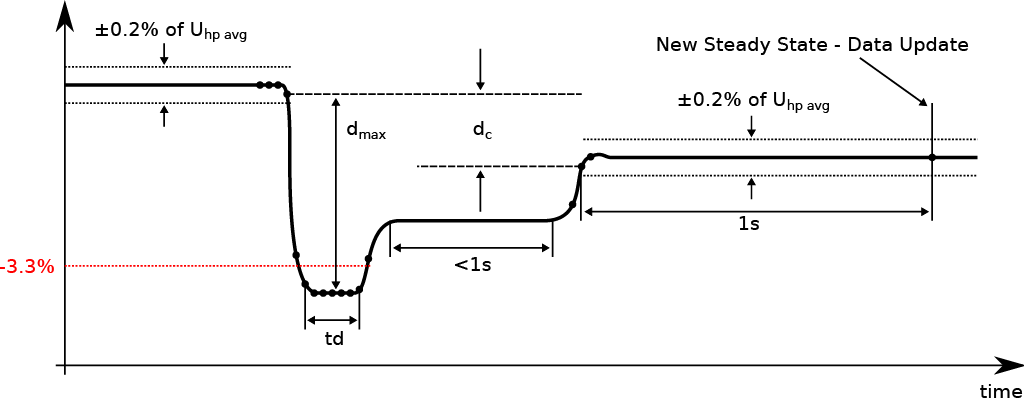
Fig. 50 Explanation of the evaluation of the d-Parameter
Attention
The half-period rms calculation goes strong with a possible channel offset and could never lead to a steady state. In this case it is recommended to zero the voltage inputs or use a 2nd order high-pass filter with 0.1 Hz to eliminate every DC component.
Attention
The Auto-Detection Mode is useful for the most applications. In the following graph you can see, which Mode is applied under different circumstances.
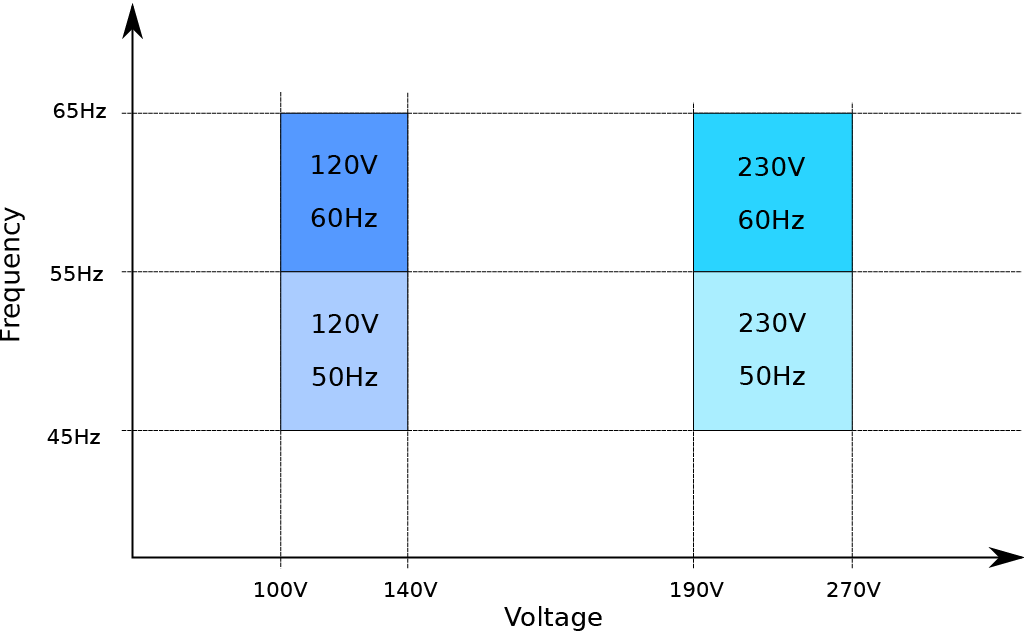
Fig. 51 Voltage Fluctuation Autodetection
Pst/Plt Aggregation Time: If the Recording is started before ready (1), the aggregation is started when ready. When recording is started while ready (2), the aggregation will be started with the recording start.
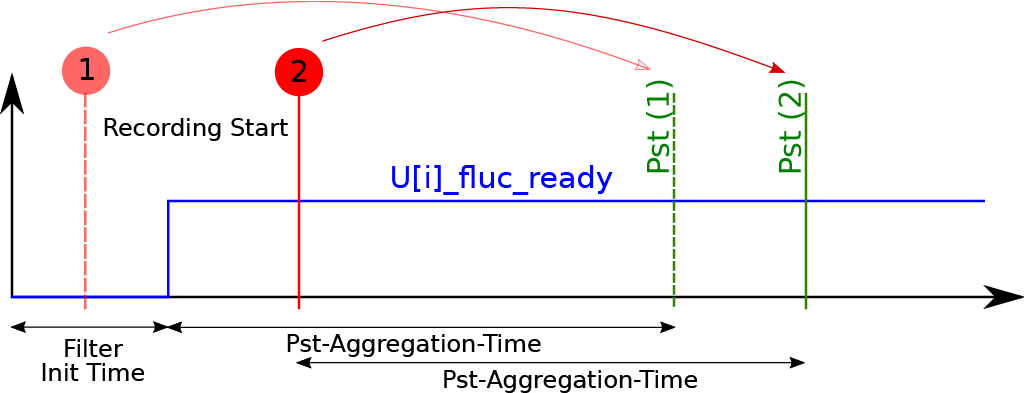
Fig. 52 Flicker Time Behaviour
Channel Reference
Symbol |
Description |
|---|---|
|
Number of Pst-Values in Plt-Aggregation-Time |

U[i]_fluc_Pst
The short-term flicker severity
U[i]_fluc_Plt
The long-term flicker severity.
![\begin{aligned}
U[i]\_fluc\_Plt &= \sqrt[3]{\frac{1}{N} \sum_{k=0}^{N-1}{U[i]\_fluc\_Pst[k]}^3} & Unit: \textbf{A}
\end{aligned}](../_images/math/09f870cb45961a91285076c7cc4a114b28801b27.png)
U[i]_fluc_Pinst
The instantaneous flicker sensation.
U[i]_fluc_ready
Indicator value for steady state of algorithm filters.
I[i]_fluc_Pst_[ ]
]
The short-term flicker emission severity according to IEC61400-21. Equal to  .
. ![\psi \in [30^\circ, 50^\circ, 70^\circ, 85^\circ]](../_images/math/8819409b8ab09b9618a2fcb0457b727ab07c17e0.png) .
.
I[i]_fluc_Plt_[]
The long-term flicker emission severity. .
I[i]_fluc_Pinst_[]
The instantaneous flicker emission sensation.
U[i]_fluc_dc
Steady state voltage change
U[i]_fluc_dc_overall
Maximum of steady state voltage change. Maximum of U[i]_fluc_dc. Initialized with 0.
U[i]_fluc_dmax
Maximum voltage change during a voltage change characteristic
U[i]_fluc_d_max_overall
Maximum voltage change of all voltage change events. Maximum of U[i]_fluc_dmax. Initialized with 0.
U[i]_fluc_td
Duration of voltage change below detection level (default: 3.3 %).
U[i]_fluc_td_max_overall
Maximum duration of all voltage change events below detection level (default: 3.3 %). Initialized with 0.
U[i]_fluc_fic_[]_hp_RMS
The Phase’s i half period RMS value of the fictitious grid, used for Stage 1 in the IEC-Flickermeter. Can be used to calculate the Voltage change factor ku. .