Getting Started
OXYGEN OPT-POWER (OXYGEN Power) is up to date Power Analyzer software option of the award winning OXYGEN Measurement Software from DEWETRON that you can use with most of the DEWETRON Hardware Devices.
In addition to the list of general features, this chapter describes how to perform the following tasks:
Activate features
Setting up transducers
Perform simple measurement
Save and load setups
Attention
DEWETRON offers taylor made product and application trainings to support you with your measurement and analysis. Please contact us for more information
General Features
The following table shows the general functions. Overview of major devices and features.
Type |
Hardware |
Bandwidth |
Samplerate |
Phasecount |
|---|---|---|---|---|
PA-TRIONet3 |
TRION3-1810-HV |
5 MHz |
1 MS/s |
4 |
LITE[PA] |
LITE[PA]-4 |
5 MHz |
10 MS/s |
8 |
DEWE3-A4/A4L/M4 |
TRION3-1810M-POWER-4 |
5 MHz |
10 MS/s |
8 |
DEWE3-PA8 |
TRION3-1810M-POWER-4 |
5 MHz |
10 MS/s |
16 |
DEWE3-RMX |
TRION3-1810M-POWER-4 |
5 MHz |
10 MS/s |
16 |
The following configuration features are available to maximize flexibility and analysis comfort:
Full flexible input configuration
Simple setup within seconds
Individual phase groups (up to 9 phases per PowerGroup)
Free selectable sync channel
Unlimited recording (only limited by harddisk space)
In addition to the great measurement functions of OXYGEN, the POWER-Option enables the detailed analysis of the phase values and total values in L-N configuration (each total and fundamental):
Voltage (RMS, AVG, PHI, Peak-Peak)
Current (RMS, AVG, PHI, Peak-Peak)
Active Power (AVG, PHI)
Reactive Power (AVG)
Apparent Power (AVG)
Power Factor (AVG)
Fundamental Frequency (0.2 – 200 kHz)
Harmonics (up to 1000th order)
Interharmonic (up to 1000.5th order)
Higher Frequencies (2-9 kHz Grouping)
Supraharmonics (8-150 kHz with 2 kHz Grouping)
Voltage Fluctuation Pst, Plt, dc, dmax, td (50 Hz, 60 Hz)
Flicker Emission Pst_fic, Plt_fic (50 Hz, 60 Hz)
Rolling Computation (Update every 1ms)
Mechanical Power Computation and Efficiency
D/Q Analysis
Note
The requirements for full functionality and maximum speed are:
CPU: Intel Core i5 3rd Generation or better
RAM: 8 GB or greater
DAQ: TRION or Orion
OS: Windows 7 64 Bit or newer (Linux Version on request)
Preinstalled DAQ driver (TRION API or Orion driver)
Installation and Operation
Switch on your DEWETRON measurement device.
Use the provided DEWETRON OXYGEN Installer if not installed already.
Start the OXYGEN measurement software (if not automatically).
After startup, you see the following measurement screen:
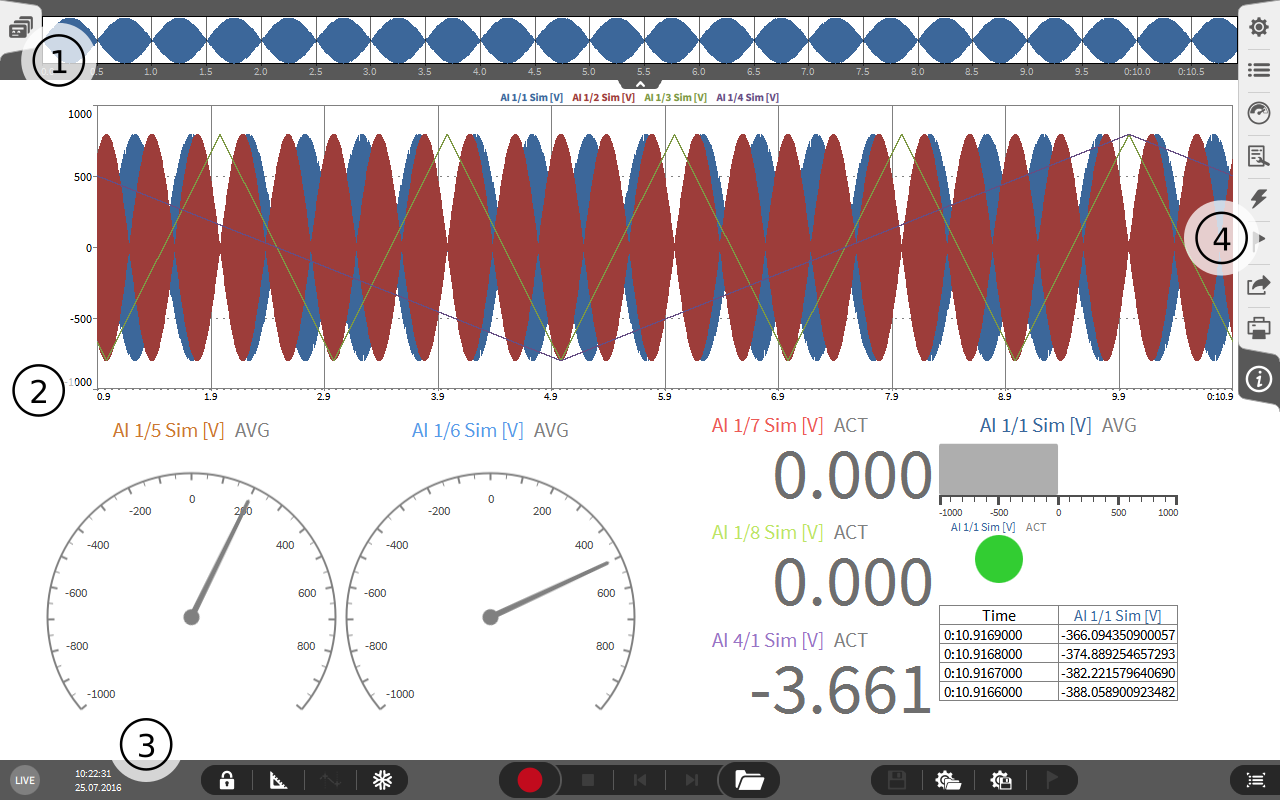
Fig. 1 Screen Area
1 |
Open screen overview |
2 |
Instrument area |
3 |
Action Bar |
4 |
Menu |
This is the “main” screen of the instrument to operate all measurements, readings, recordings and settings. There is not only one screen, you can define a couple of them, each with different instruments and views to stay focused during the measurement application. To open the Screen Overview, just click or slide 1. The Instrument Area 2 is the place, where you can drag’n’drop all different instruments (recorder, scope, digital meter, gauge, power instrument…) and arrange them as you like. All actions can be performed in the Action Bar 3 to start/stop a recording, load and save data and configuration setups. The bar on the right side is the Menu Bar 4 contains the settings in logical groups.

Fig. 2 Action Bar
5 |
Instrument state indicator |
13 |
Jump forward |
6 |
Screen lock |
14 |
Open Data File for Analysis (.dmd) |
7 |
Design mode |
15 |
Save changes in Data File (Play Mode) |
8 |
Activate/Deactivate cursor for active instrument |
16 |
Open configuration setup (.dms) |
9 |
Freeze screen content |
17 |
Save configuration setup (.dms) |
10 |
Start recording / Arm trigger |
18 |
Insert marker during recording |
11 |
Stop recording |
19 |
Open/Close channel overview list |
12 |
Jump backward |

Fig. 3 Menu Bar
20 |
Open measurement settings and recording file name |
25 |
Open event list |
21 |
Open channel overview list |
26 |
Open export menu |
22 |
Open instrument selection |
27 |
Open print/screen copy menu |
23 |
Open current selected instrument properties |
28 |
Open info screen and OXYGEN setup |
24 |
Open trigger and storing options menu |
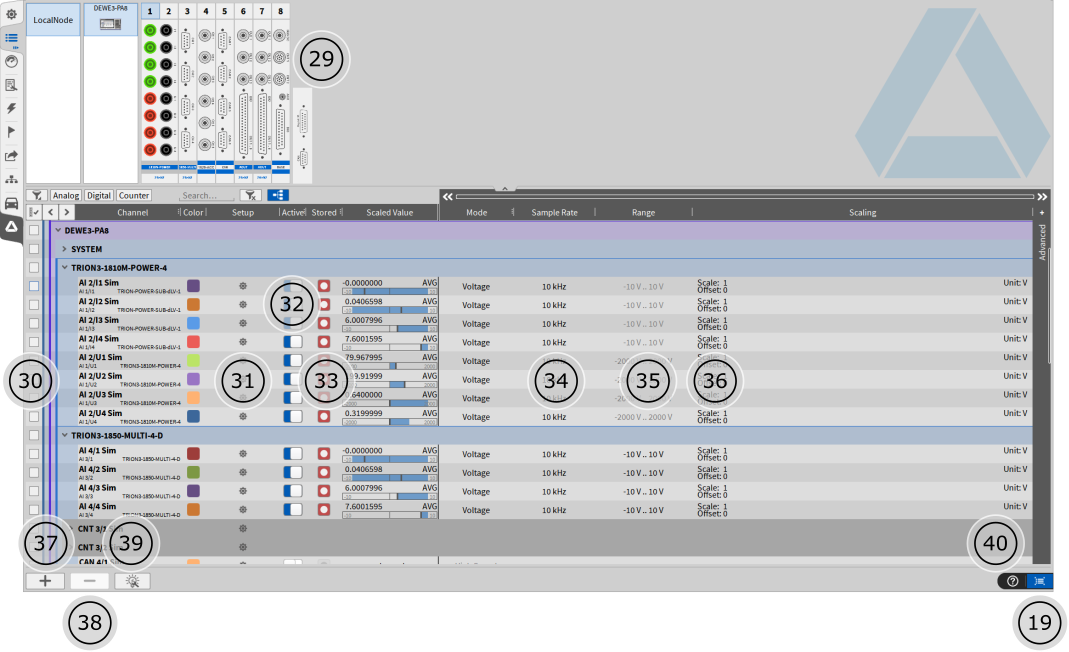
Fig. 4 Channel Overview List
29 |
Graphical and interactive input view |
36 |
Scaling settings |
30 |
Multi-Select indicator |
37 |
Add calculated channel (statistics, filter, formulas, etc.) |
31 |
Channel detail setup |
38 |
Delete selected channels (if possible) |
32 |
Channel active slider |
39 |
Create PowerGroup with selected channels (channel count must be even number) |
33 |
Storing indicator (red when stored, grey only for viewing) |
40 |
OXYGEN help and welcome tour |
34 |
Sample Rate selector |
19 |
Open/Close channel overview list |
35 |
Range selector |
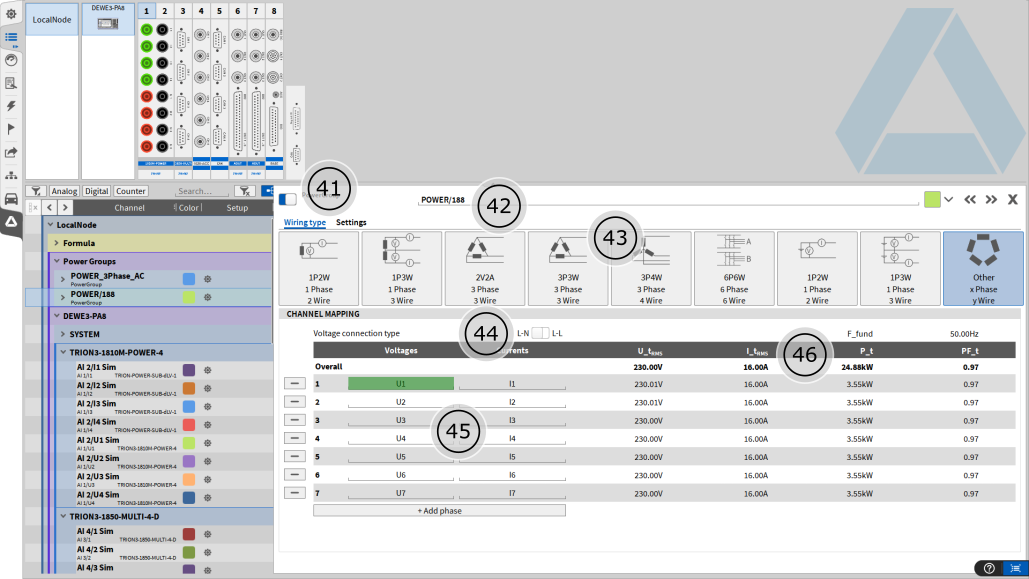
Fig. 5 PowerGroup Setup
41 |
Switch between Wiring Type and advanced Settings |
44 |
Voltage input connection type switch (L-N: Input is Line-Neutral Voltage, L-L: Input is Line-Line Voltage) |
42 |
Name of PowerGroup (click to change) |
45 |
Phase input channels (drag’n’drop from left channel list) |
43 |
Selected Wiring Type (choose one of the pre-defined or Other) |
46 |
Overview Table |
Functional Check
For a quick functional check and first measurement experience, use a test cable (mains plug with to safety banana plugs) and test voltage magnitude.
Switch on your DEWETRON device.
Connect the mains plug of the test cable to a wall socket and the banana plugs to an voltage input of the DEWETRON device.
Navigate to the channel list on the screen 19 or 21.
Set Samplerate to at least 100 kHz.
Press “Create Power Group” button 39.
Select the Wiring Type 1P2W in the selection above.
Drag’n’Drop the Voltage Input channel into the U1 Field.
Drag’n’Drop Current Input channel into the I1 Field.
Check mains voltage in the preview.
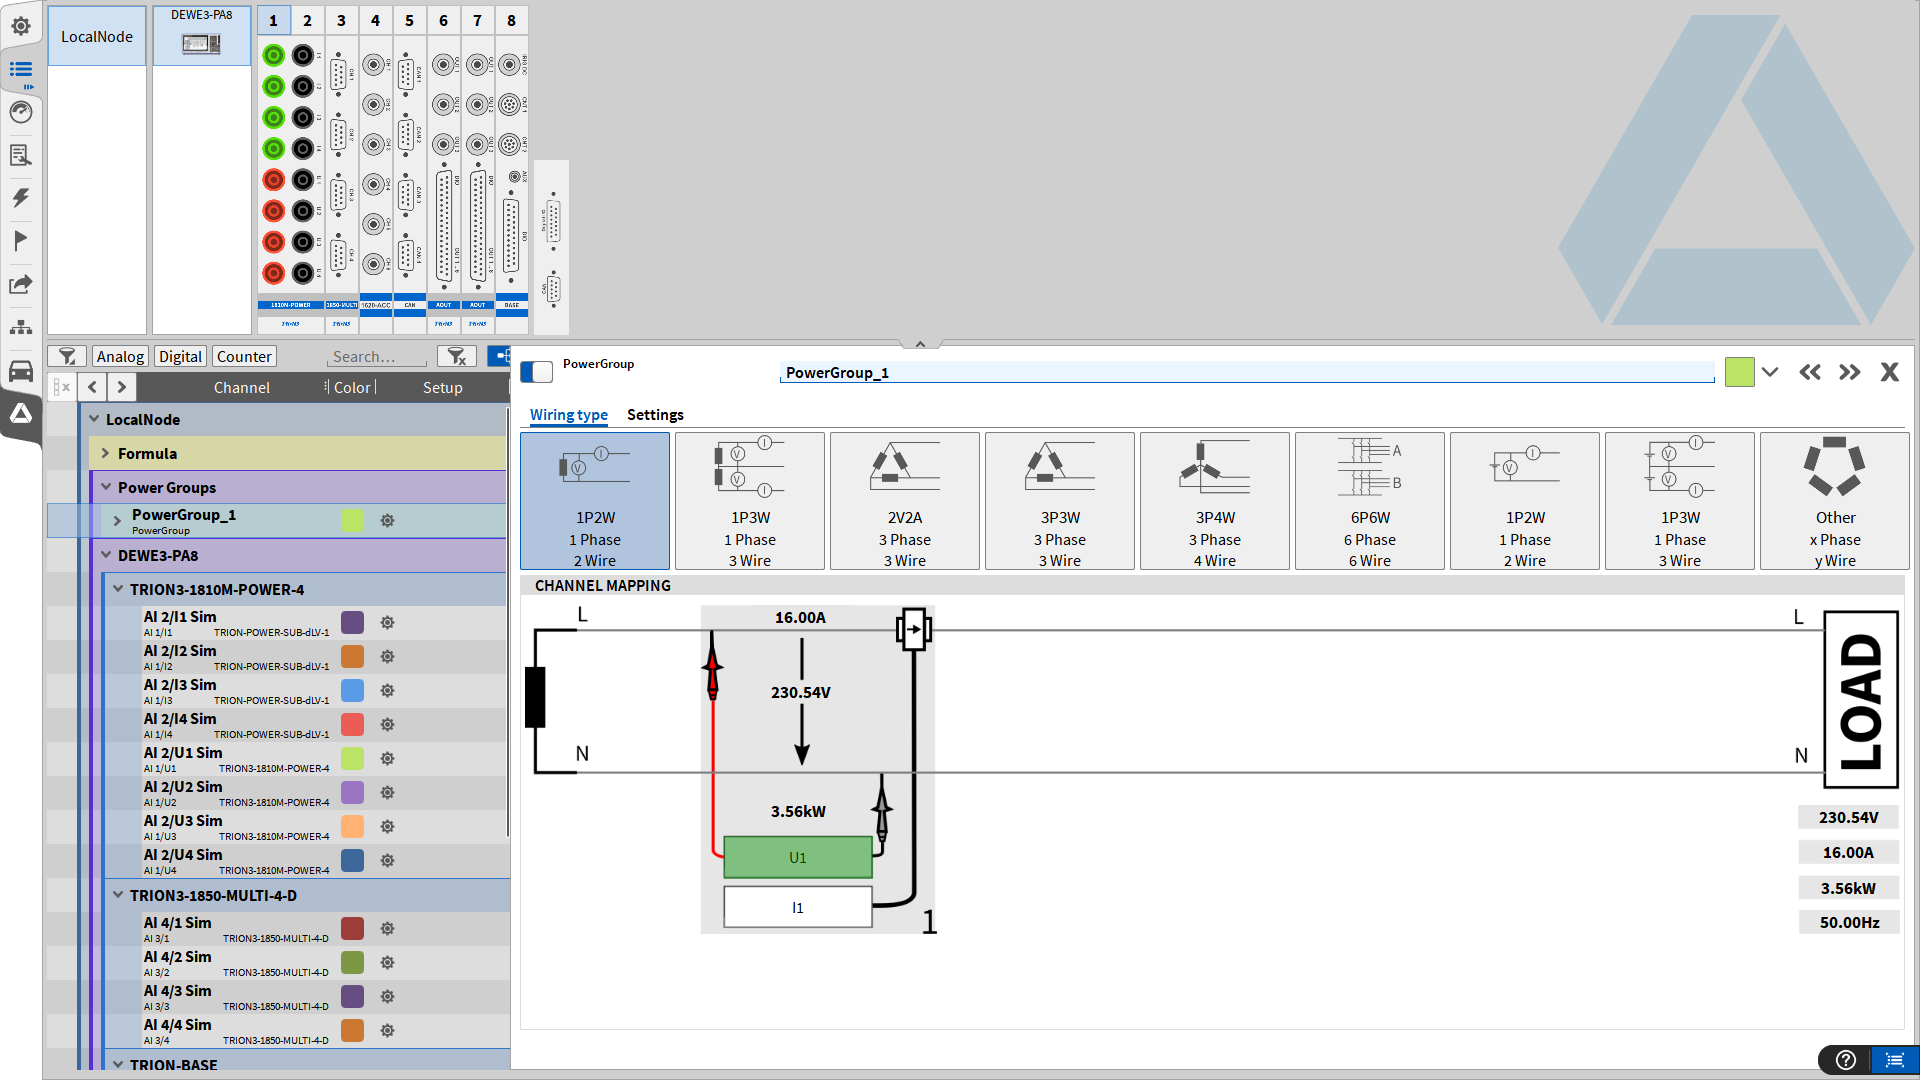
Fig. 6 First Setup
Attention
The green highlighted box is the actually selected synchronisation source.
Note
Make sure, that you use only an appropiate isolated input channel. Examples for this are TRION(3)-POWER and TRION(3)-HV boards.
Setting up sensors
To make properly measurements, the sensor scalings (e.g. current transducers) have to be set correctly. In the most cases, the sensor label gives information about the input/output scaling. This value is often known as “transducer factor”, “ratio” or “sensitivity”. Important is the unit of the scaling, e.g. 20 mV/A or 50 A/V or 1:50. The order to input the correct scaling is the following:
Click/Touch the “Scaling” field of the concerning channel 35.
The Channel Scaling pops up to change the defaults.
Change the unit to the primary measured unit (e.g. A for Amps).
Enter the scaling value directly if given in the shown unit (e.g. A/V).
If the sensitivity is given, select the sensitivity button and enter the value.
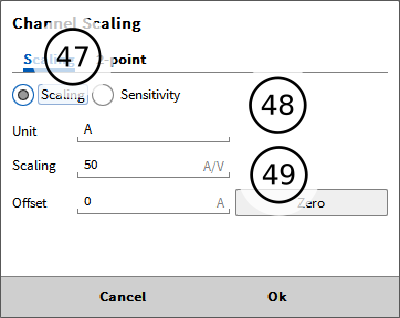
Fig. 7 Channel Scaling
47 |
Scaling/Sensitivity selector (switch between modes) |
49 |
Unit field, input physical value here |
48 |
Scaling/Sensitivity input (according to shown unit) |
Arrange Instruments
Now it is time to launch the measurement.
Leave the channel setup by pressing 19 (or sliding 21)
Clear the screen by opening the instrument selector 22 and pressing the button “Clear” at the bottom.
Create an instrument (e.g. Power Instrument) by changing to the channel list (press 21) and drag’n’drop the PowerGroup channel onto the instrument area (Default Name of PowerGroup is POWER/Number).
Arrange and resize the instrument for a good view.
Add another instrument by moving to the instrument list 22 and drag’n’drop an item to the screen.
Append Channels by selecting them from the channel list 21.
Power Instrument
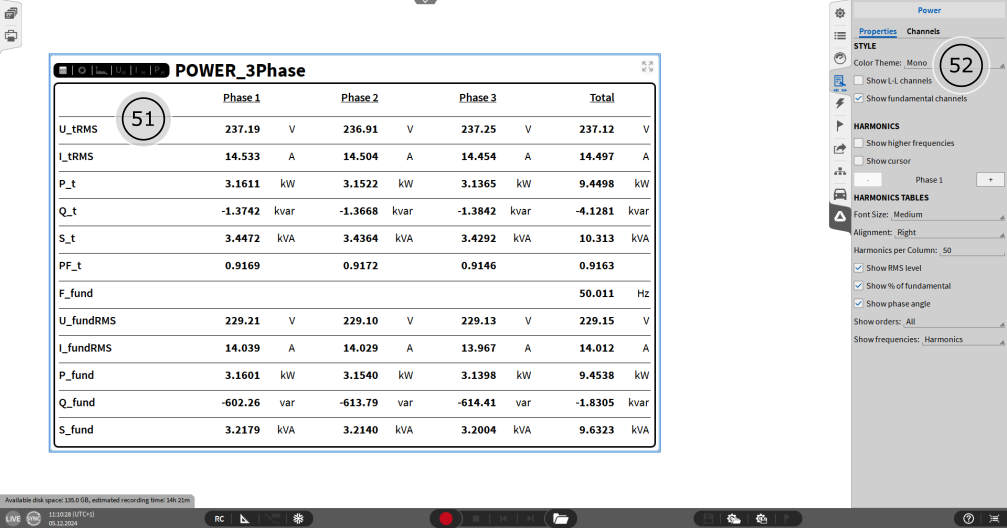
Fig. 8 Power Instrument
50 |
Name of shown PowerGroup |
52 |
Instrument settings |
51 |
Instrument view selector (Overview Table, Phasors, Harmonics) |
You can also add other instruments to the screen, simply by drag’n’drop. To add a channel to specific instruments, just select them in the channel list and drag’n’drop on the instrument. Or simple select the instrument first and assign channels afterwards by selecting them in the channel list.
Power Screen Templates
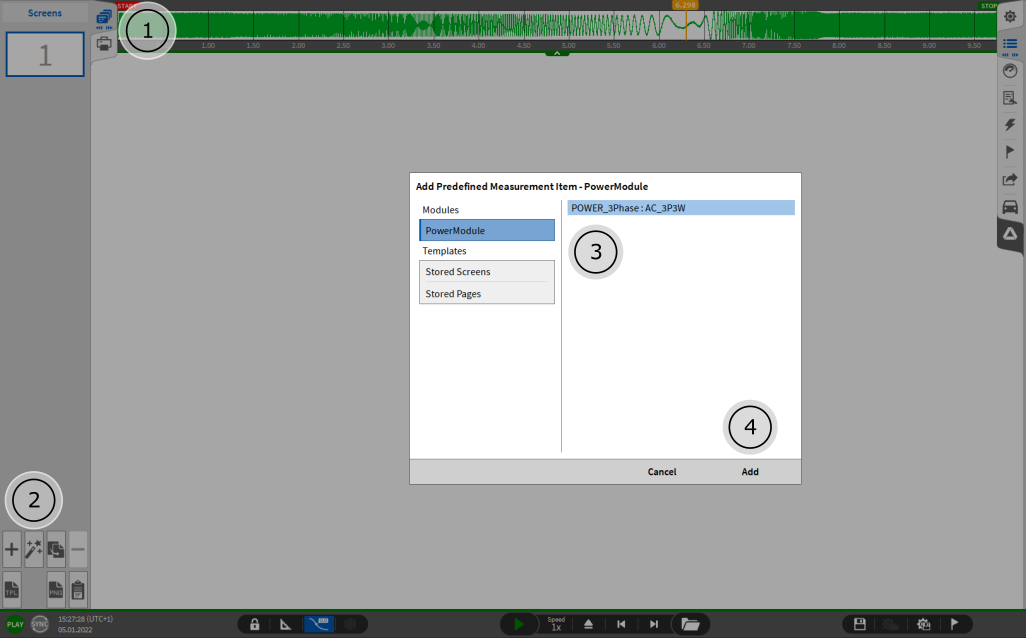
Fig. 9 Power Templates Setup
1 |
Open Screens |
3 |
Select Power Module Template |
2 |
Add predefined item |
4 |
Add Power Screen Template |
Adding the predefined PowerModule for a Power Group will add a new measurement screen with a prearranged group of instruments. This is available for each created Power Group in your setup. Templates are available for each wiring type.
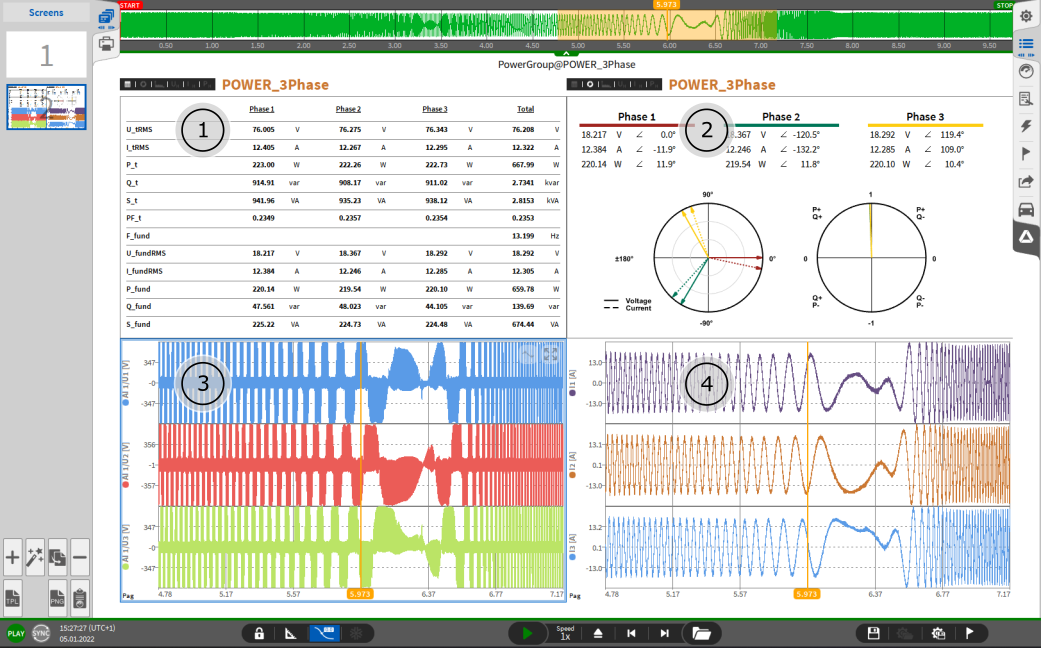
Fig. 10 Power Templates Screen
1 |
List display of the power instrument |
3 |
Voltage Chart Recorder in Range of 10 seconds |
2 |
Vector diagram of the power instrument |
4 |
Current Chart Recorder in Range of 10 seconds |
The Power Templates always consist of a group of 4 instruments. The top 2 instruments are displaying the calculated power values in list and vector form. The bottom two instruments are displaying the raw waveforms of voltage and current in chart recorders. The voltage signals and the current signals are displayed in one chart recorder respectively. The signals are displayed in a time range of 10s and automatically scaled to fit to the value-axis. The two chart recorders are linked, so scrolling in one recorder to change the time scale will also affect the other recorder in the same way. Double clicking on any instrument on the template measurement screen will open the Instrument Group Settings. You can change the Instrument Group display name, visible on the top center of the screen and you can dismantle the group into each separate instrument. After dismantling the Group it is possible to resize and rearrange the instruments as well as changing individual instrument settings.