Operating Basics
The DEWETRON OXYGEN is arranged in different easy-to-use functional areas. This chapter provides a quick overview of the controls and visualisations.
The PowerGroup Idea
To understand the terminology of the PowerGroup and the PowerPhase, let’s explain it with the following graphics: The PowerGroup consists of multiple PowerPhases which are Voltage-Current pairs. Each PowerPhase is evaluated individually and synchronously. The PowerGroup values are aggregated values from each PowerPhase and share their common fundamental frequency (Common Sync) which can be chosen separately.
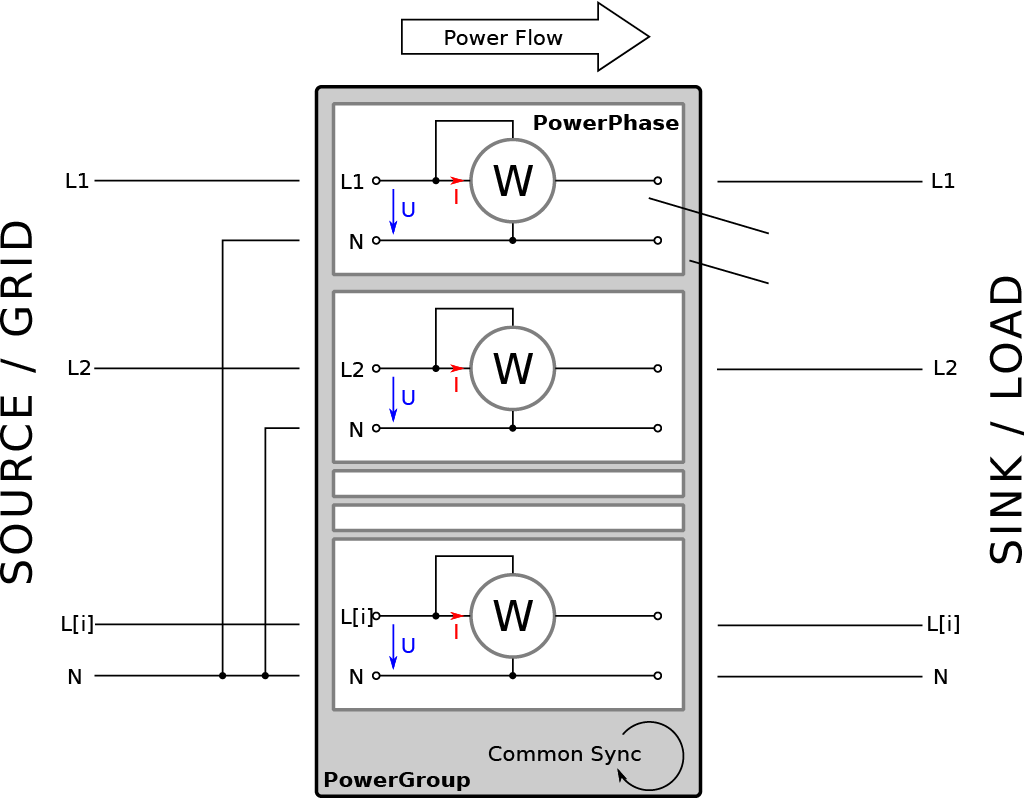
Fig. 16 PowerGroup Schematic
Connection Types
This design is open to be used with almost every connection type and phase count.
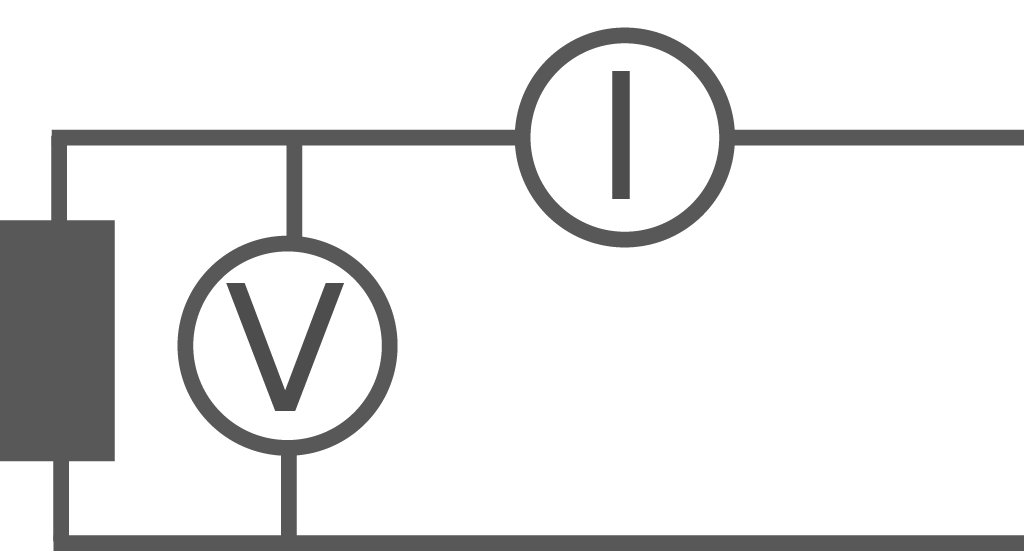 1 Phase (AC) Line-Neutral (1P2W)
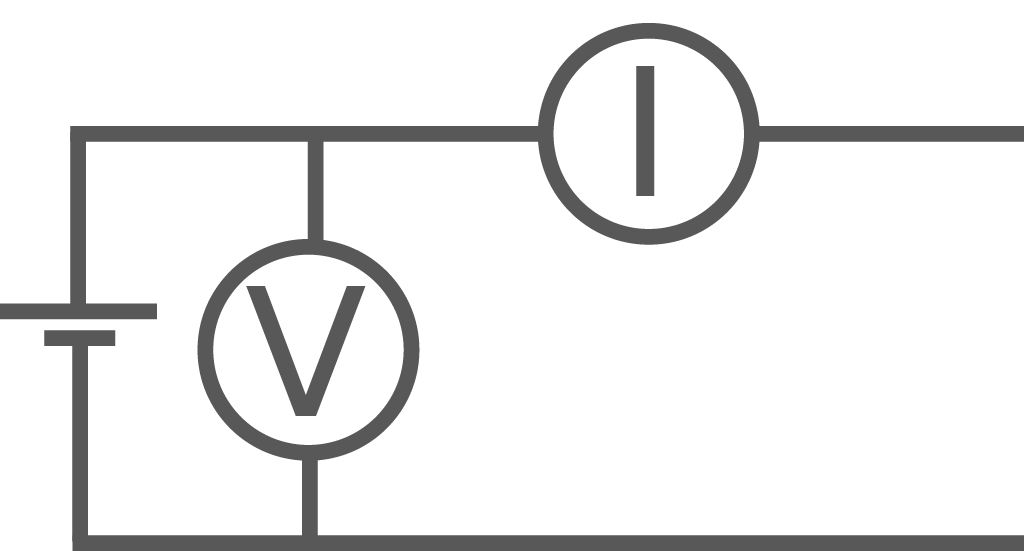 1 Phase (DC) Line-Neutral (1P2W)
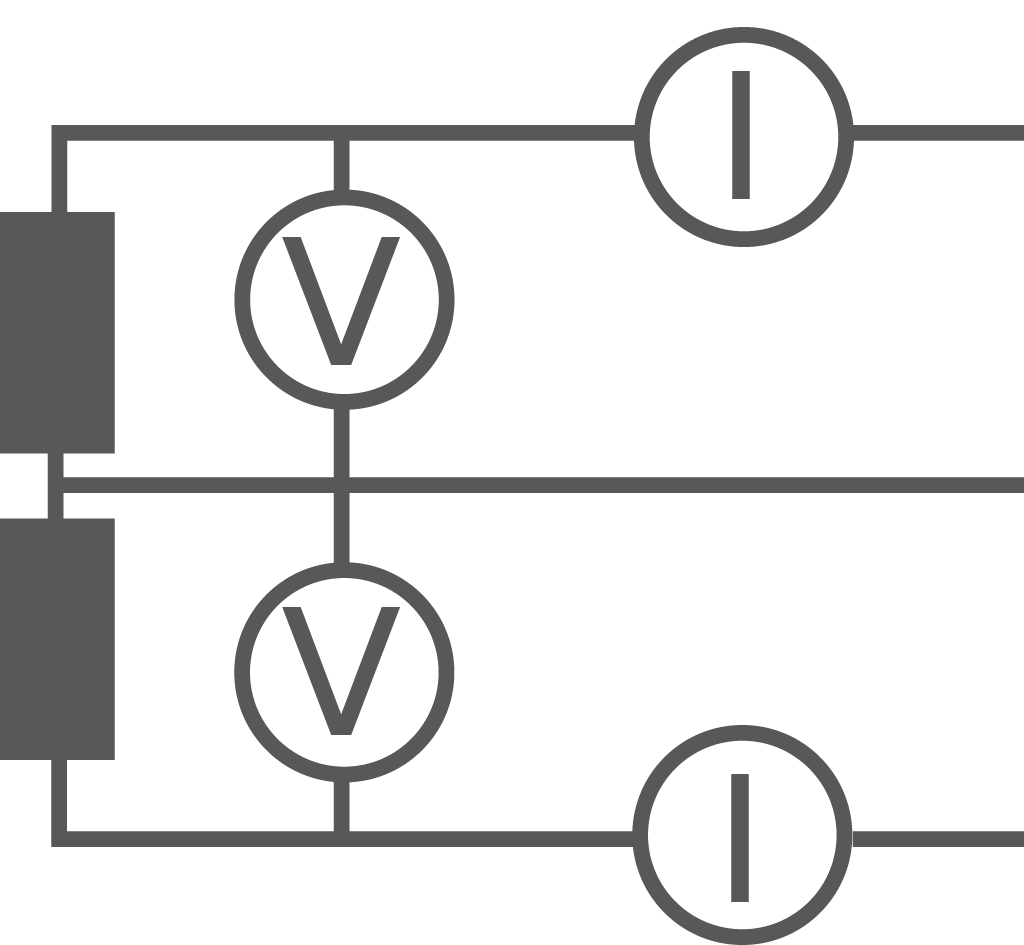 2 Phase (AC) Line-Neutral or Line-Line (1P3W)
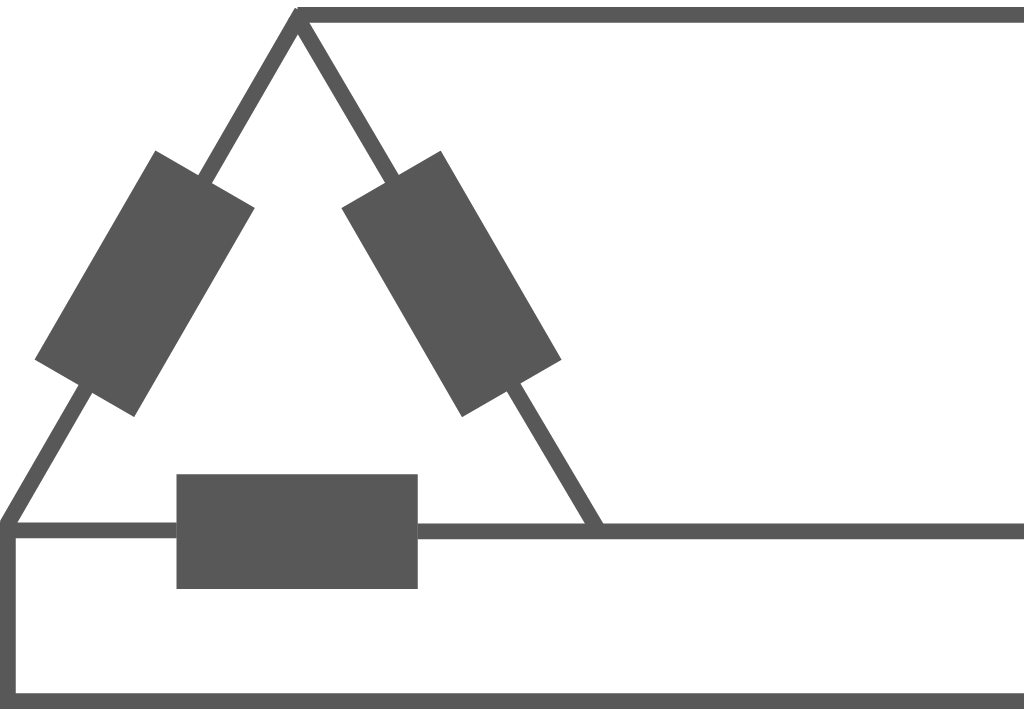 3 Phase (AC) Line-Line 2-Wattmeter (2V2A)
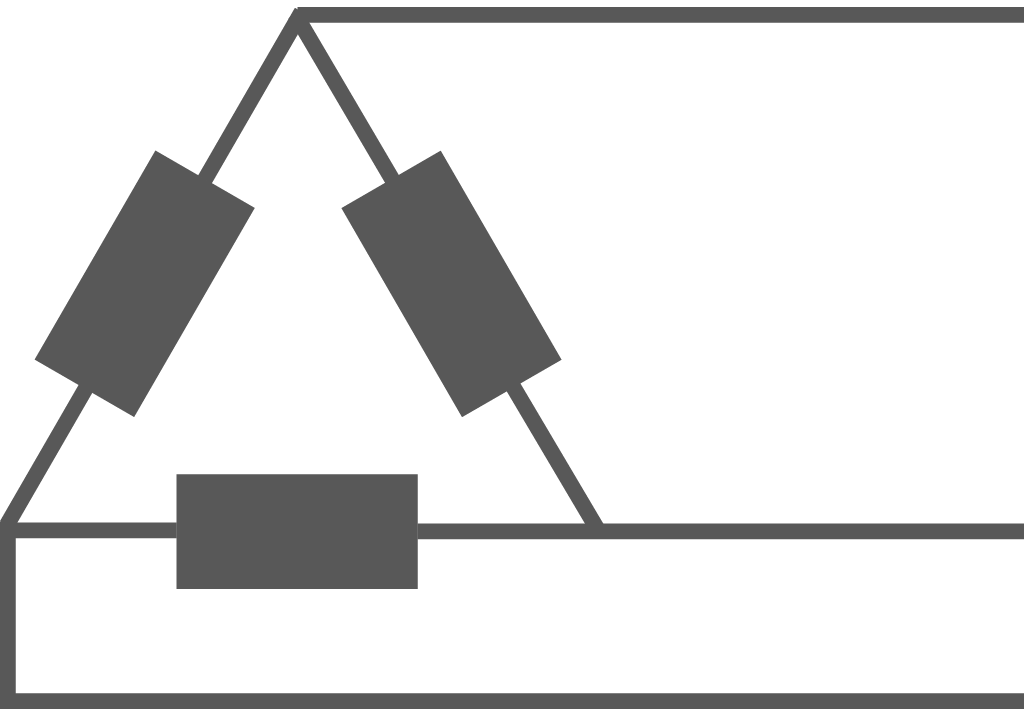 3 Phase (AC) Line-Line (3P3W)
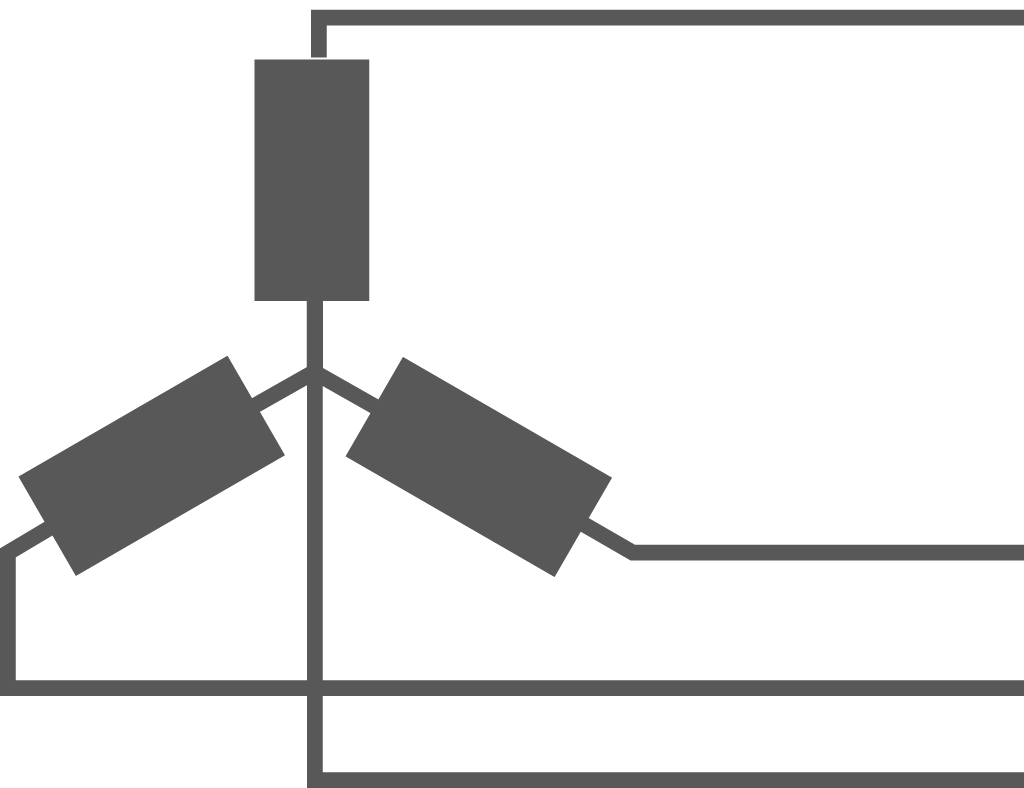 3 Phase (AC) Line-Neutral (3P4W)
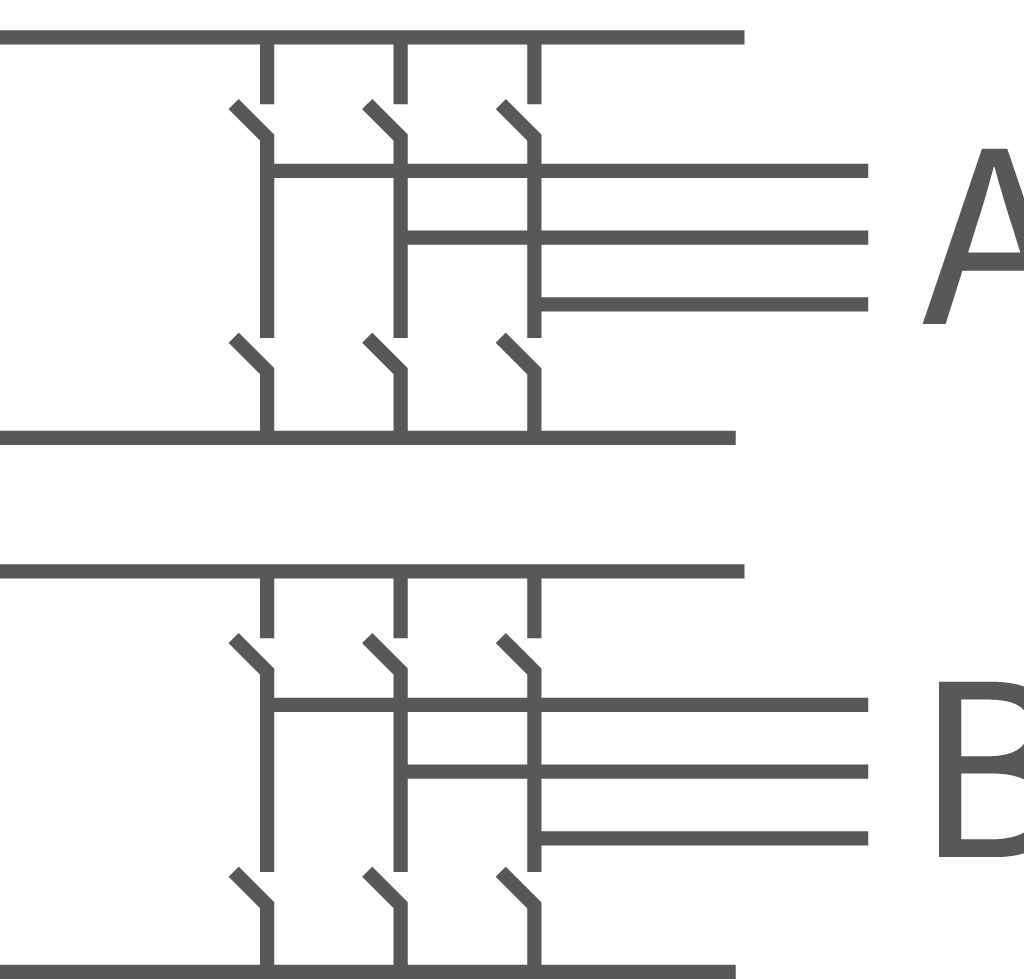 6 Phase (AC) 2x Line-Line (2x 3P3W)
 Individual Grid with up to 9 phases
Attention
Every PowerGroup can be used with any type of connection. This enables you, to do simultaneous measurements on different grid types and compare them online.
Single Phase (AC)
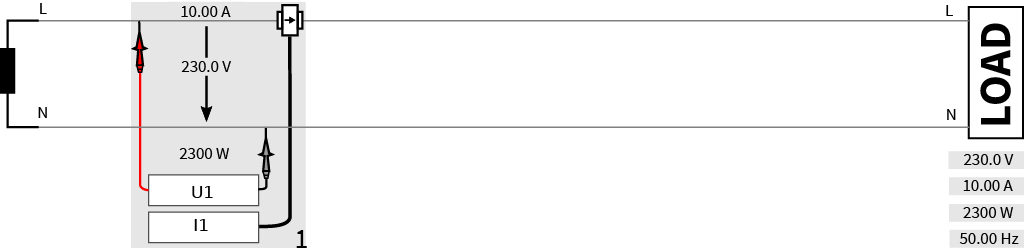
Fig. 17 Single Phase (AC)
|
|
|
|
Single Phase (DC)
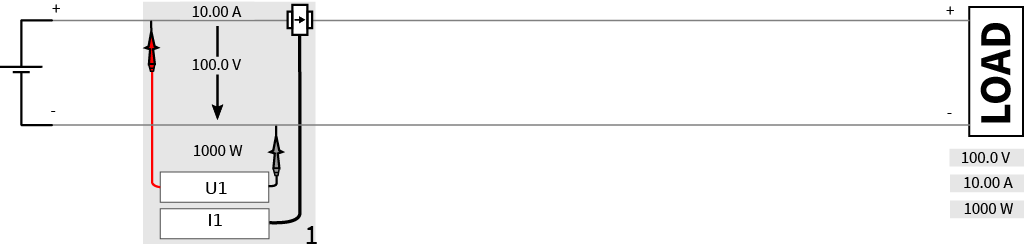
Fig. 18 Single Phase (DC)
|
|
|
|
Two Phase with Neutral (AC)
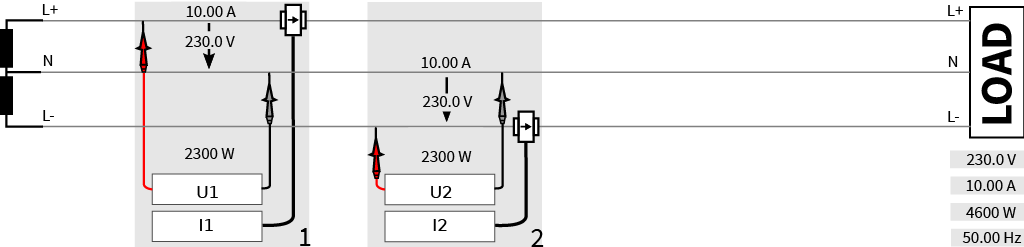
Fig. 19 Two Phase with Neutral (AC)
|
|
|
|
Two Phase (DC)
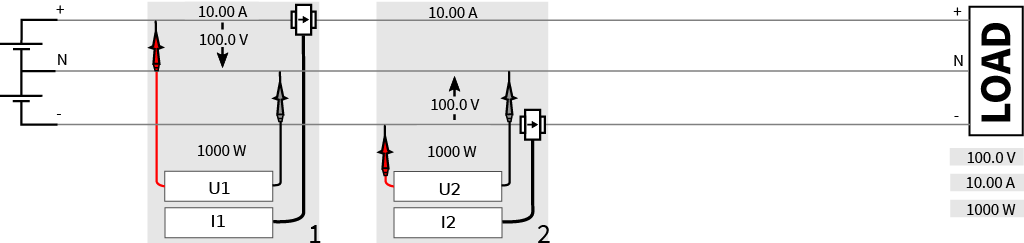
Fig. 20 Two Phase (DC)
|
|
|
|
Three Phase Wye (AC)
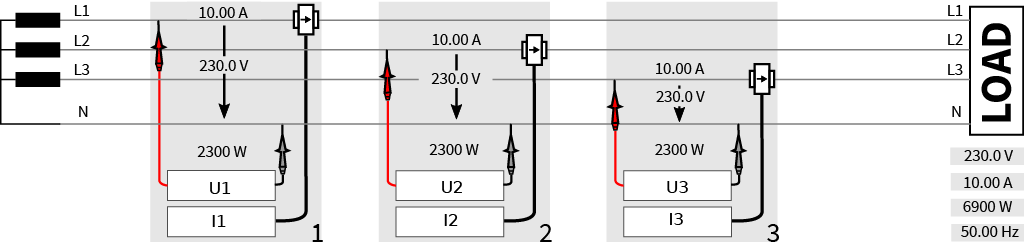
Fig. 21 Three Phase Wye (AC)
|
|
|
|
Three Phase Delta (AC)
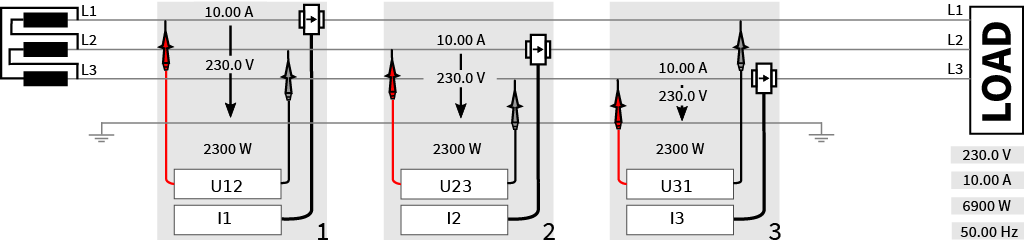
Fig. 22 Three Phase Delta (AC)
|
|
|
|
Three Phase 2-Wattmeter (AC)
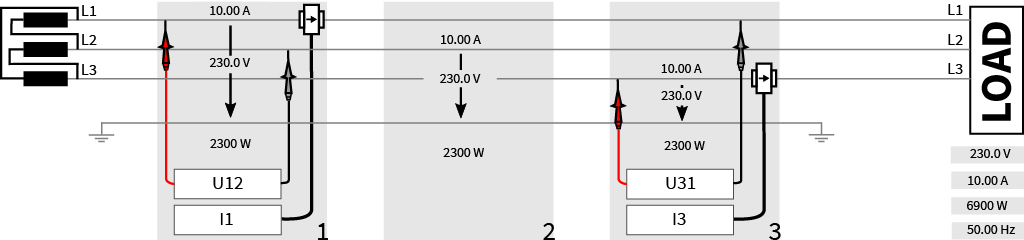
Fig. 23 Three Phase 2-Wattmeter (AC)
|
|
|
|
Six Phase (AC)
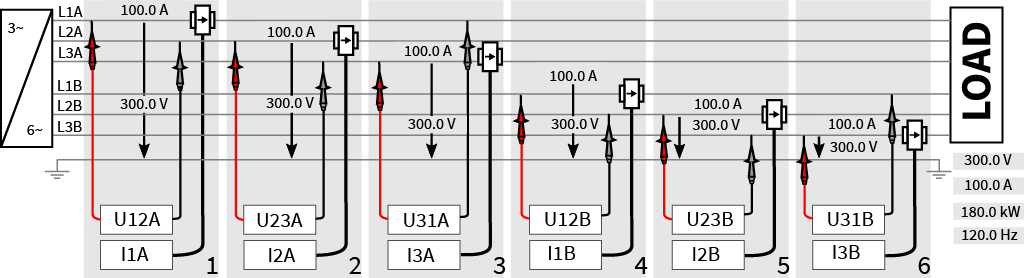
Fig. 24 Six Phase (AC)
|
|
|
|
Attention
The phase relation between the voltage and current lines is shown in the graphics below and is following this terminology: Phase of Voltage Channel 1 (U1_fundPHI) is defined with 0 and all other phase angles of Voltage (U[i]_fundPHI) and Current (I[i]_fundPHI) are relative aligned to this phasor. The Power phase is the phase difference between its Voltage and Current Phasor.
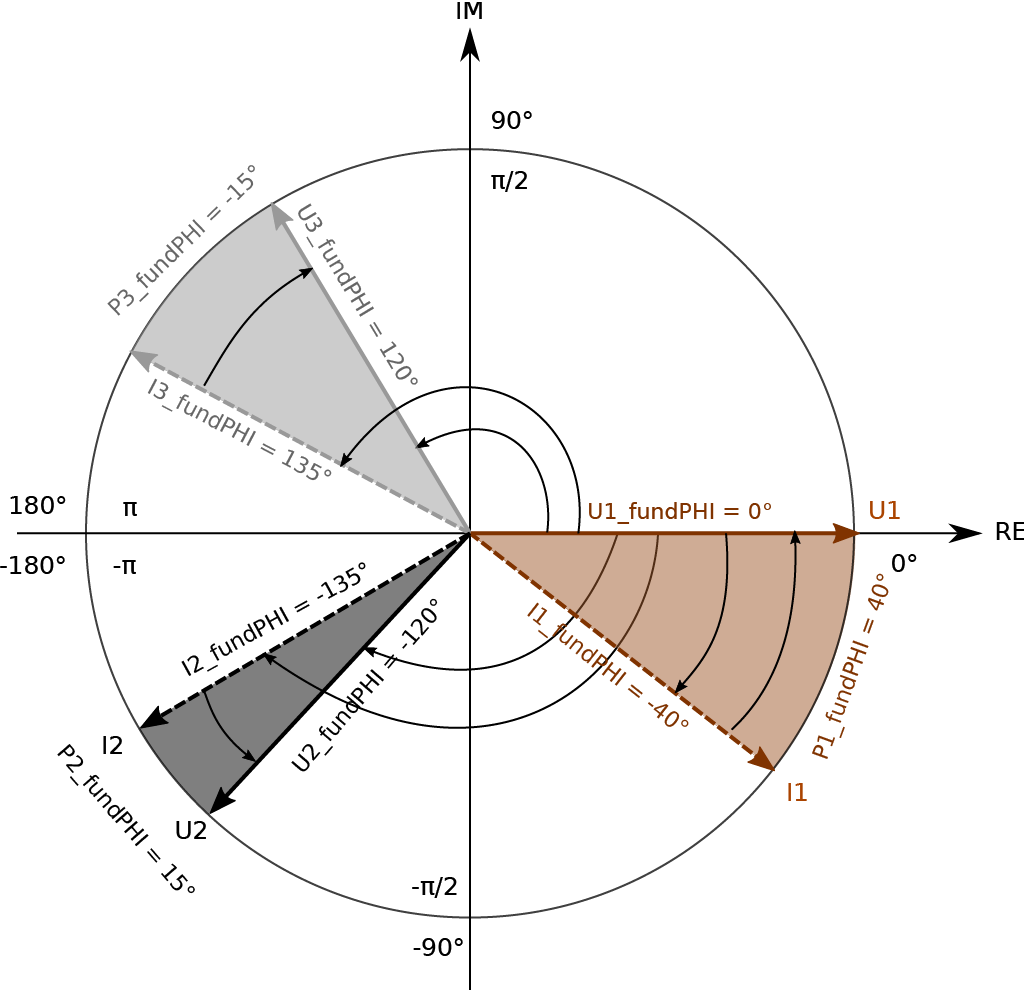
Fig. 25 Current Phasor
Line-Line Conversion
The Conversion from Line-Line Voltage to a Line-Neutral Voltage is automatically performed if necessary:
Connection Type Switch is set to L-L
Schematic is 3P3W or 6P6W
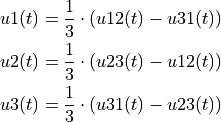
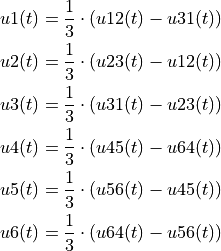
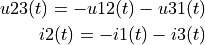
The principle relies on a virtual Star-Point, where the sum of all Line-Line Voltages AND the sum of all Line-Neutral Voltages is zero at all time.
3-Phase
6-Phase
Attention: This Calculation Method changed from 5.0 to 5.1! This 6-Phase calculation is now a 2x3P3W Calculation.
2-Wattmeter
Power Instrument
The PowerGroup Instrument is a dedicated visualisation instrument for a specific PowerGroup. To place one in your instrument screen, just drag’n’drop the PowerGroup channel into the instrument area. Today, the instrument comes with 3 separate screens, an overview table, the phasor diagram and the harmonic chart. In the instrument properies 23, you can select a different color schema.
Table Display
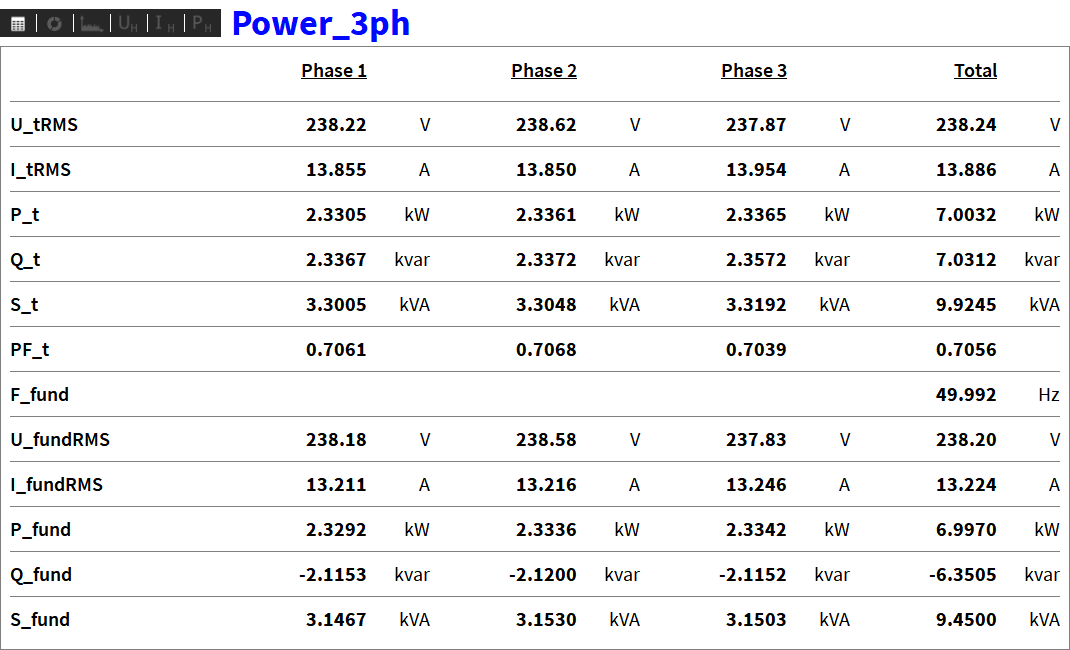
Fig. 26 PowerGroup Instrument Table
The Table consists of the PowerGroup name at the top, basic power values for each PowerPhase and their overall values. The display update rate is fixed to 500 ms.
Instrument Settings
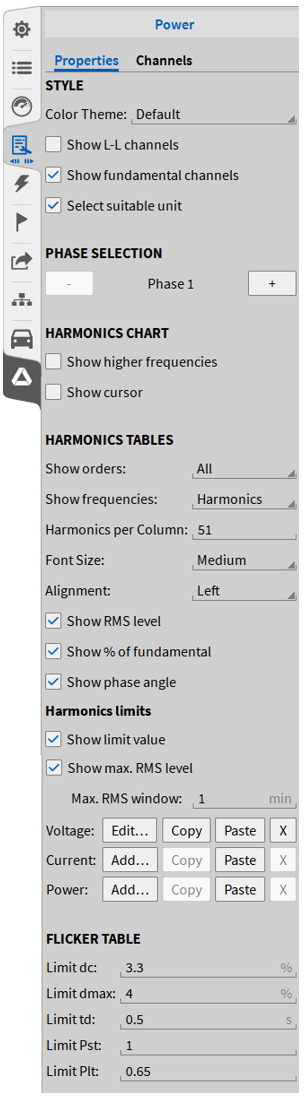
Fig. 27 Instrument Settings
Style
Select Colour theme
Enable/Disable the display of Line-Line Voltage values
Enable/Disable the display of fundamentals
Enable/Disable suitable prefixes for units (mV, μV, kV)
Phase Selection
Select Phase to be displayed in Harmonics Chart and Flicker Table
Harmonic Chart
Show also Higher Frequency Grouped Spectrum (2.1–8.9 kHz)
Show Cursor in Harmonics Chart
Harmonic Tables
Select displayed entries per column
Show odd, even ar all orders
Show Harmonics, Interharmonics or Both
Enter How many Harmonics per column should be displayed
Select Font Size
Select Text Alignment
Enable/Disable RMS, % of fundamental or phase angle columns
Harmonics Limits
Enable/Disable Limit Value (defined below)
Enable/Disable max. RMS level with evaluation period (lookback time 1min by default)
Add, Edit, Copy, Paste or delete Limit Values for Voltage, Current, Power
Flicker Table
Enter dc Limit
Enter dmax Limit
Enter Pst Limit
Enter Plt Limit
More Flicker settings are in the Power Group advanced settings, see chapter Introduction.
Phasor Display
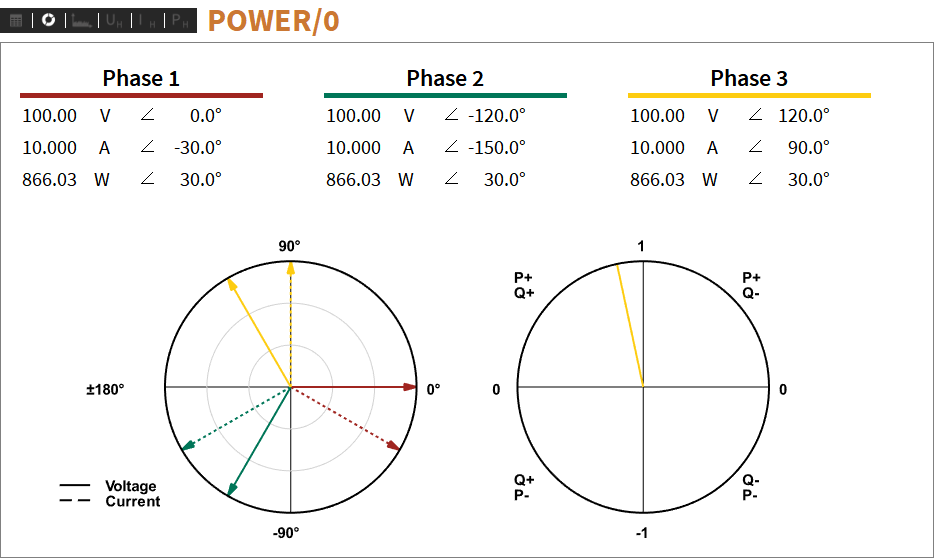
Fig. 28 PowerGroup Instrument Phasors
On the Phasor page, you can see the Voltage and Current fundamental Phasors in the left graph. The right graph shows the active and reactive power flow and its quadrant. For more information about the angle conventions, see Fig. 25.
Harmonics Chart Display
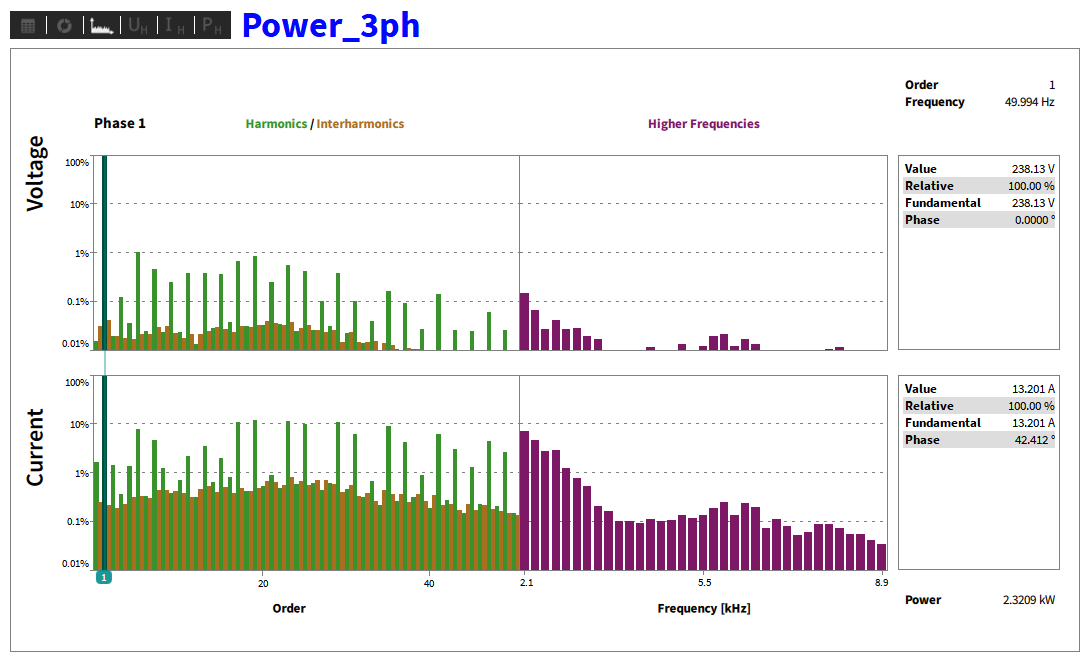
Fig. 29 PowerGroup Instrument Harmonics Chart
This view shows the voltage and current harmonics, interharmonics and higher frequency parts of the signal. The shown Phase and the cursor can be selected in the instrument details setup. The cursor can be moved over the whole spectrum to get absolute values. More technical information is available in chapter Harmonic Analysis Reference (OPT-POWER-ADV).
Harmonics (Limits) Table Display
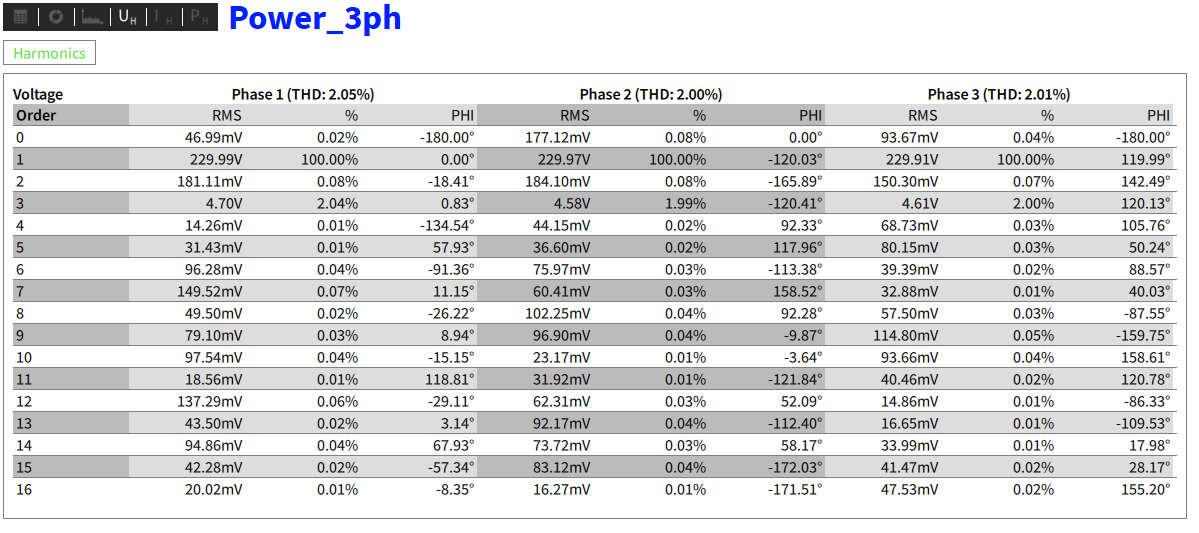
Fig. 30 PowerGroup Instrument Harmonics Table (without Limits)
This three views shows the voltage, current and power harmonics in tabular view. The parameters shown in the table can be tuned in the instrument detail settings to reduce the shown data. RMS-Level, % of Fundamental or Nominal (selectable in Power Group settings) and Phase angle can be activated, as well as the number of shown orders ALL, EVEN, ODD. Harmonics, Interharmonics or both can be displayed. Number of entries per column can also be modified in the instrument settings. CTRL+C to Copy the data to e.g. Excel.
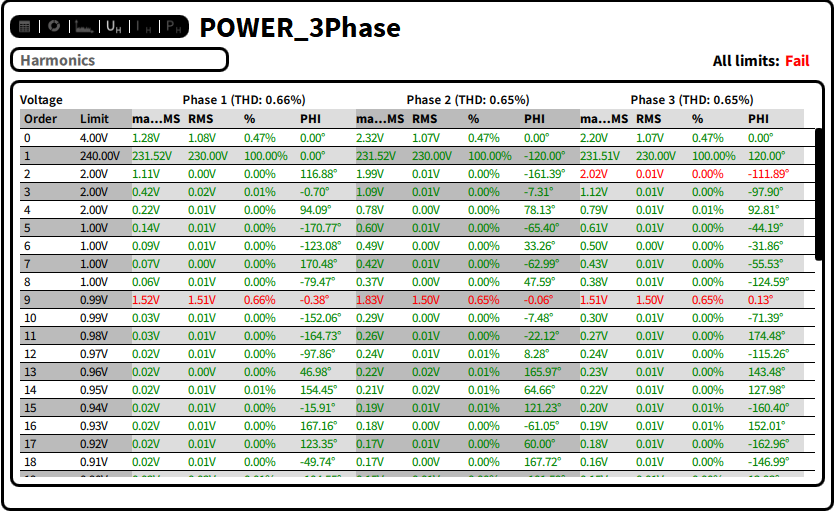
Fig. 31 PowerGroup Instrument Harmonics Table (with Limits)
This view is the same display type as the harmonics in tabular view shown above but with harmonics limits enabled in the Power Group Instrument Settings, see Instrument Settings. The Limit columns shows the defined limit from the instrument settings tab. Voltage, Current and Power Limits can be defined. The 1min lookback period by default allows evaluating if the limit has been exceeded within the last 1min. If any element (order) has been over the limit it will be colored red and “All limits:” in the top right will show “Fail” for the Fail case. Otherwise it will show “Pass”.
Flicker Table Display
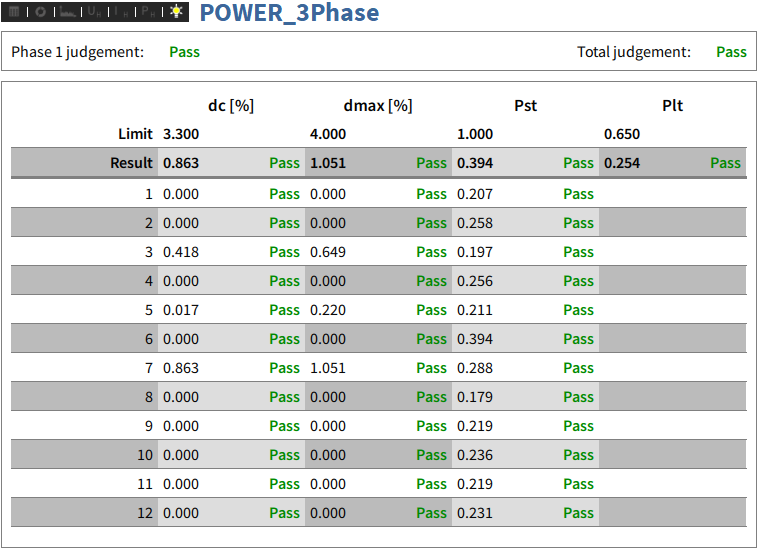
Fig. 32 PowerGroup Instrument Flicker Table (pass case)
This view shows the flicker results. The limits shown in the table can be tuned in the instrument detail settings. Total judgment, the Phase judgment and Plt will only be availible after one Plt time window (default 120 min, but definable in the power group settings). The Result row below the limits show the worst result from the list below. In case the worst result is not exceeding the defined limit each parameter dc, dmax, Pst and Plt will be in the pass case. If that is true for all Phases, the Total judgment, seen on the top right will show pass. In case one element in the list shows Fail for any phase, the Total judgement will show Fail. CTRL+C to Copy the data to e.g. Excel.
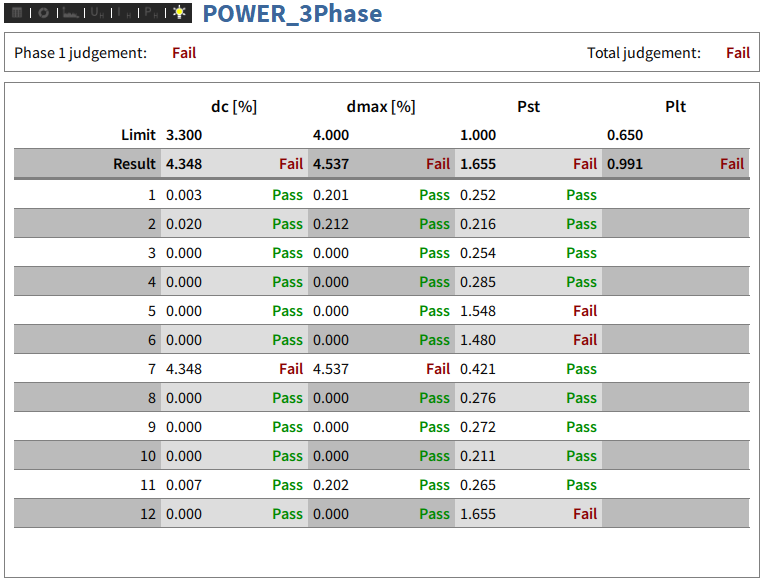
Fig. 33 PowerGroup Instrument Flicker Table (fail case)
As in the picture above, this shows the Power Group Flicker Table, but the fail case. Total judgement shows Fail, since at least one Result element exceeds the Limit. The Flicker Table will show the last Plt cycle, but it will not stop after the first window. The next Pst elements will be recorded and displayed in the list in brackets (as element (13), (14) and so on). These values will only be respected for the result row above if the next Plt period has passed. CTRL+C to Copy the data to e.g. Excel.
Load/Save Configuration Setup
To save your configuration (Input Settings, Channel Names, Instrument arrangement…) you just have to press the Save Setup Button 17 and select a name, that you can easy find it again the next time you do the same measurement.
Loading is similar to saving, just press Load Setup Button 16 and select the configuration you want to load.
Recording Data
Recording of the measurement data is very easy and flexible with the DEWETRON OXYGEN software. There are many options available to perfectly fit your requirements.
How to choose the right mode and settings, you have to think about some questions:
What do you need to analyze?
Channels: Exclude not needed channels from being stored 31.
Samplerate: Select appropriate sampling rate according to your application.
What do you expect?
Trigger: Is it possible to set a trigger condition?
Static/Dynamic: Is the signal static or dynamic?
How long does it take?
Recording Time: Do you have to record only seconds or minutes or hours and days?
How is the analysis done?
Live: Do you want to analyze the data during recording?
Offline: or afterwards in the OXYGEN Software?
Export: or do you want to export the data to use it in a 3rd party app?
For more information, consult the OXYGEN Manual OXYGEN Manual.
Analyze Data
For more information, consult the OXYGEN Manual OXYGEN Manual.
Export Data
For more information, consult the OXYGEN Manual OXYGEN Manual.