Data Recording
Push Record Button (see red arrow Fig. 11)
Runup the machine - The display should now fill with data - If needed, adjust the “Contrast” with the colr control, adjust the range with CTRL + mouse - wheel on the color bar (see Fig. 11)
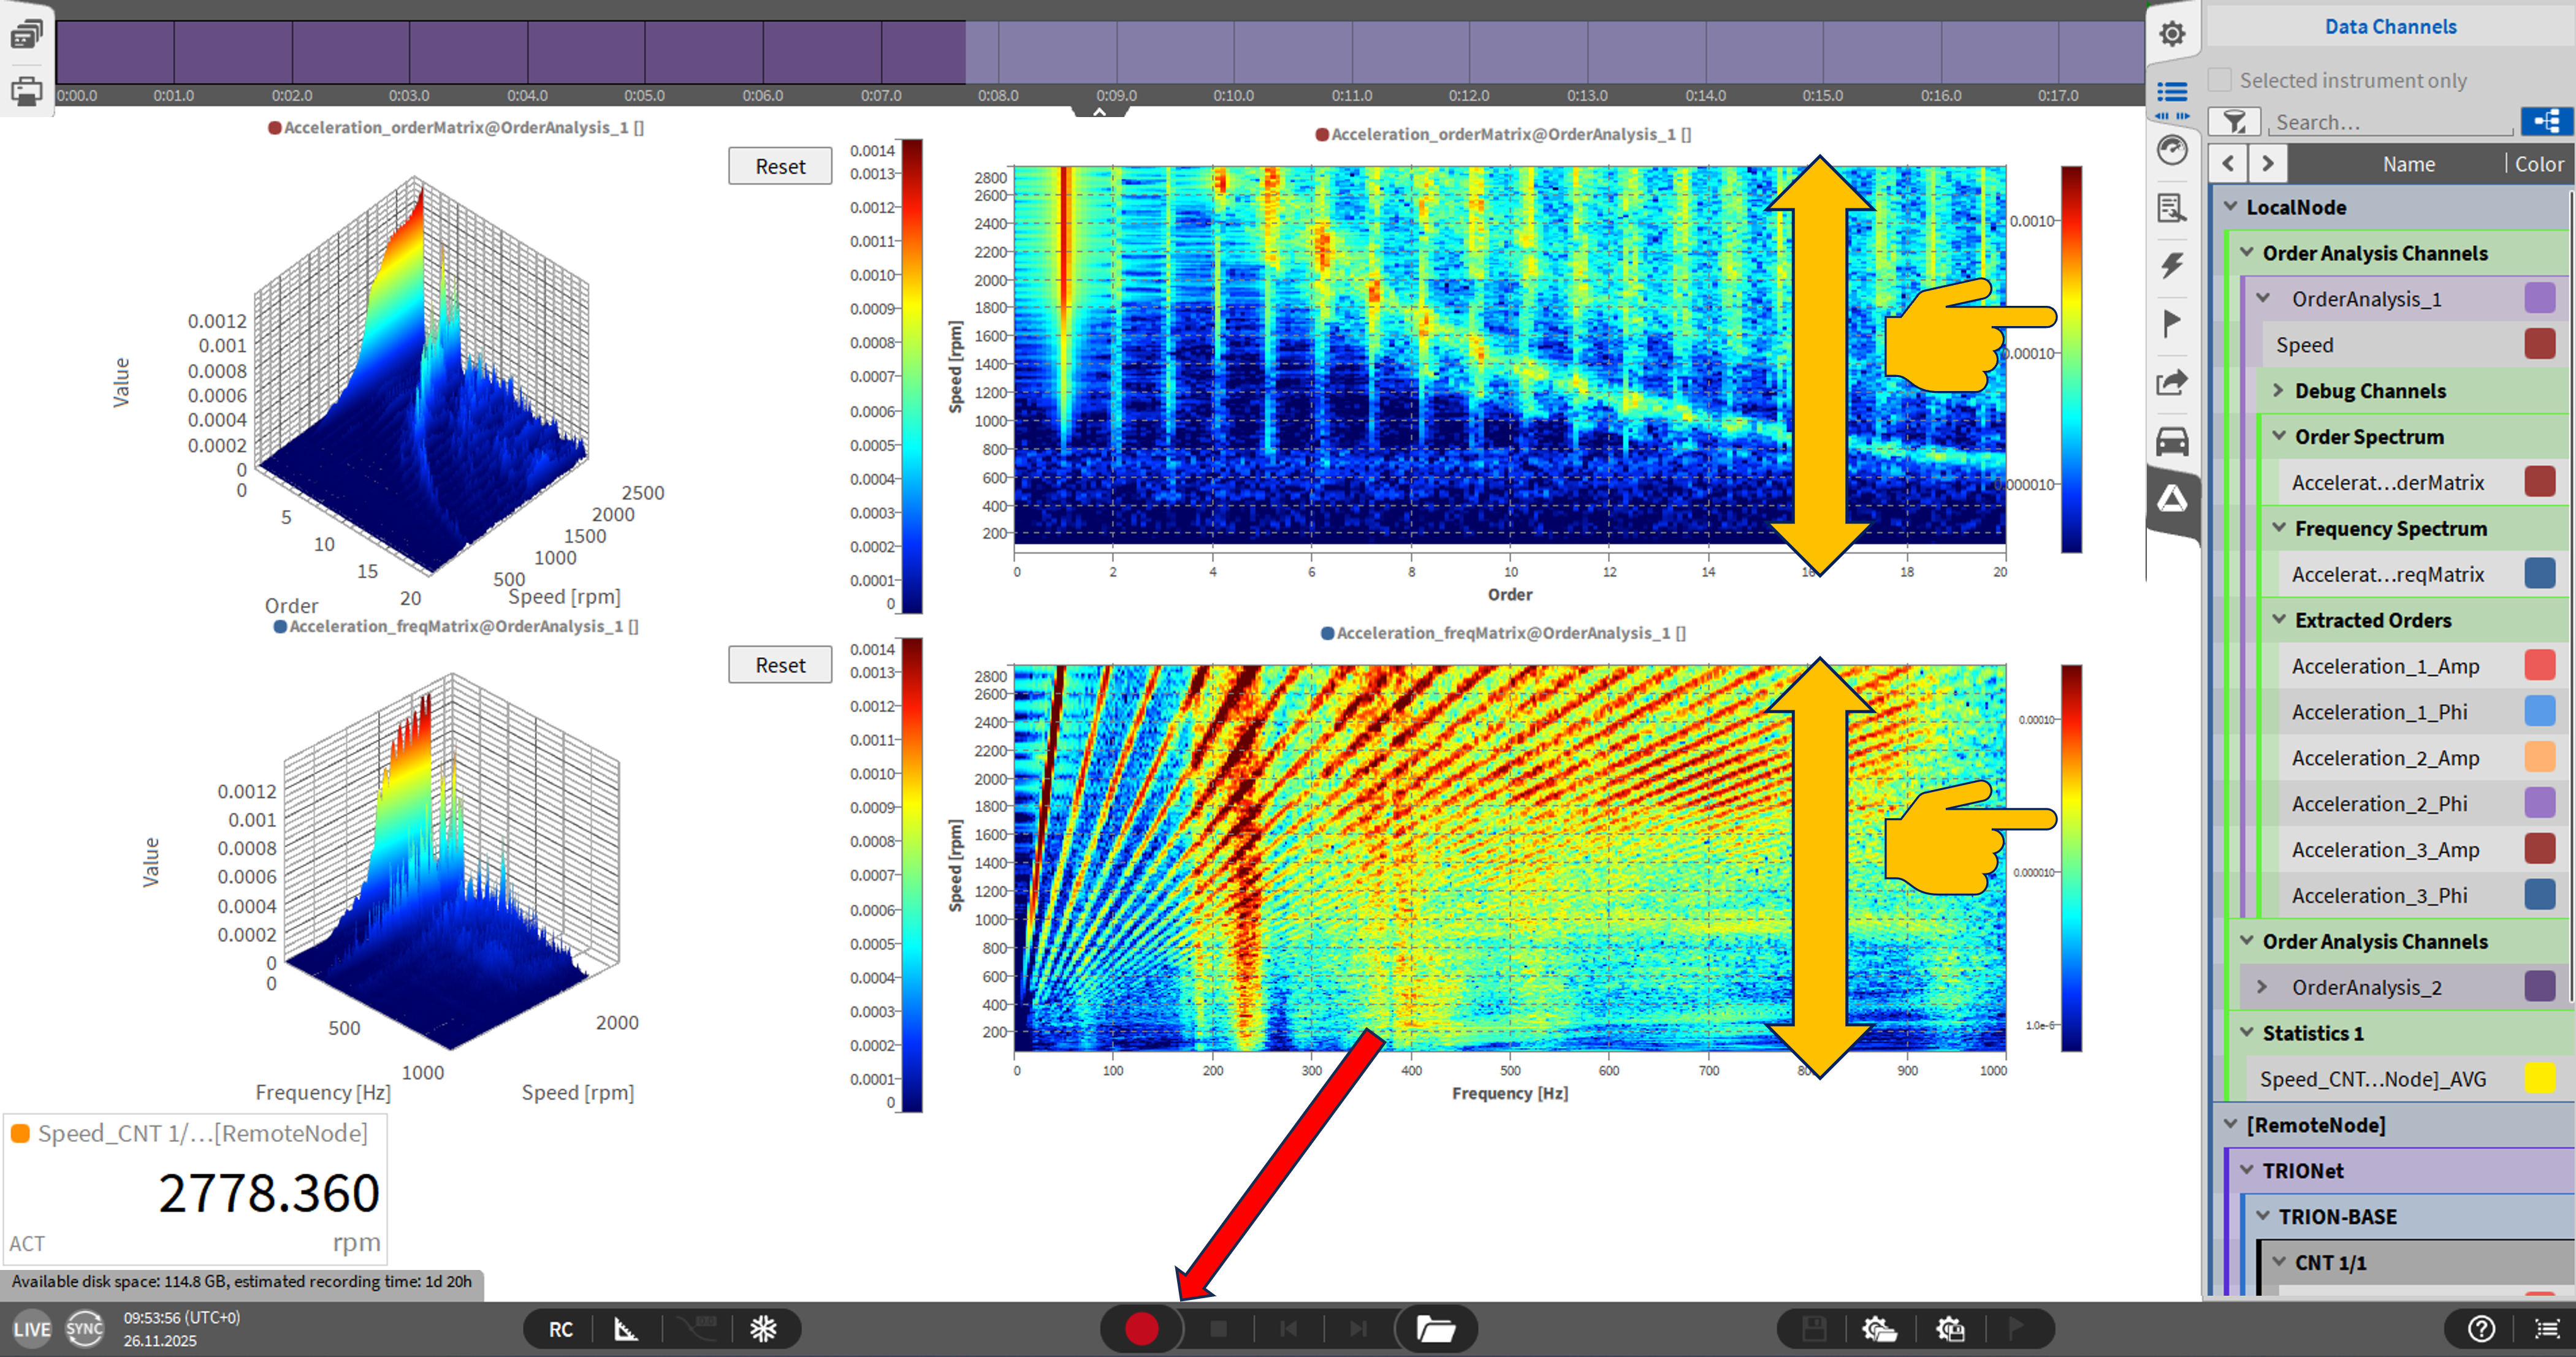
Fig. 11 Changing the contrast of the intensity charts
Observe the measurement
Stop the measurement
Open data
View the data
Zoom of the instruments (see arrow button marked red in Fig. 12)
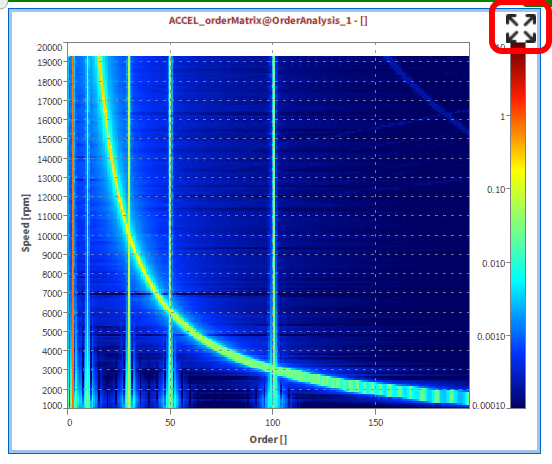
Fig. 12 Enlarge instruments to the full screen
Zoom in the instrument
With mouse wheel
With box zoom: Right click and move the mouse
Undo with right mouse button