Operation Basics
In this chapter, the steps to carry out a modal test are described. This requires a sound setup of sensors see Setting up data channels , and the definition of a test object, assignment of chnnels, and trigger settings, see Creating a Modal Test .
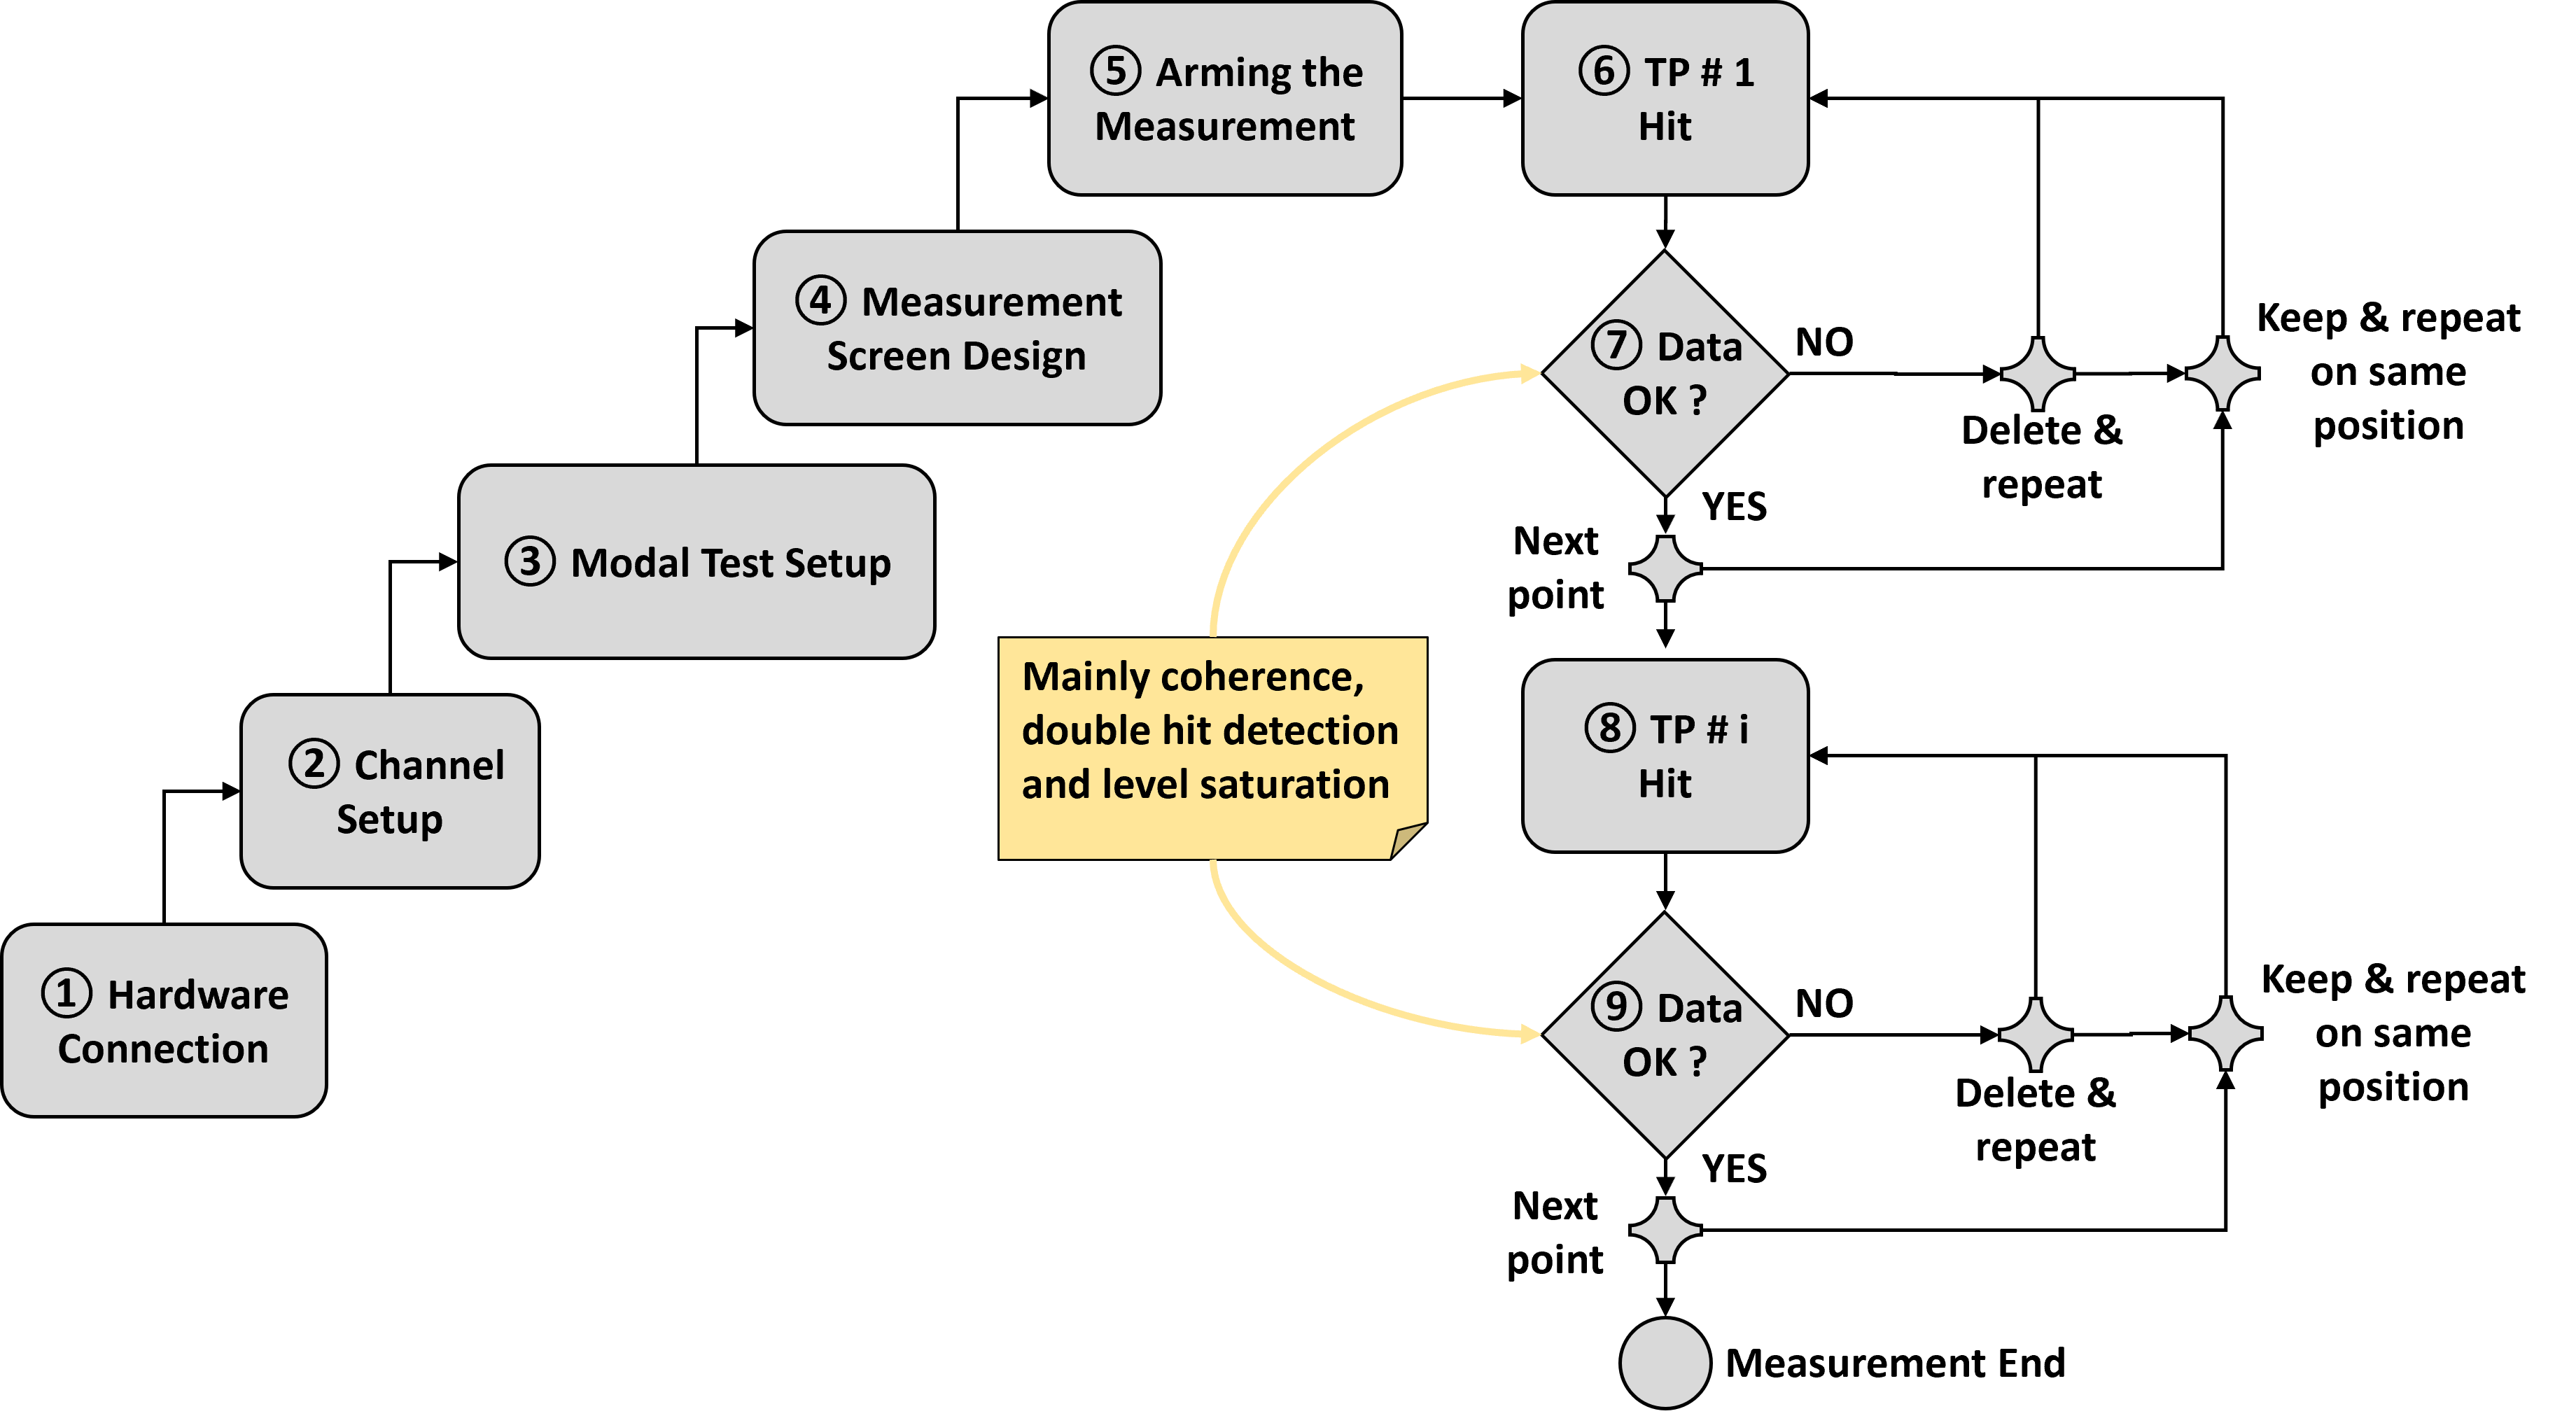
Fig. 28 Workflow
1 |
Connect an excitation device (hammer) and mono/triaxial accelerometers to the hardware. |
6 |
Carry out an excitation at the first excitation point. |
2 |
Configure the input/response channels depending on sensors (see Setting up data channels). |
7 |
Check after each hit/excitation if the data is valid (depending on the test setup multiple hits per point have to be made and individually evaluated). Repeat hits until all excitation events for this position are completed correctly. |
3 |
Modal Test Setup (Create a test object, define input channels, configure Trigger & FRF). |
8 |
Continue to the next excitation point and carry out an excitation. |
4 |
Measurement screen design (Load Modal Test Screen template and optionally edit). |
9 |
Evaluate the data and repeat until the test is complete, then stop the recording. |
5 |
Arming the measurement and start recording (Make sure the “Active” button is enabled). |
As shown by Fig. 28 above, the acceptance or rejection of an excitation event is a central step in the recording of modal data. OXYGEN MODAL Test includes several options to warn the user of potentially flawed measurements. Based on the settings in the ”Trigger & FRF” tab following flaws are marked:
Double hit warning (% of triggered peak): pink
Range warning (% of range): orange
Range exceeded (> signal range, this is always active): red
If no excitation is recorded whatsoever, check the trigger level in the ”Trigger & FRF” tab and the ”active” button in the modal test screen.
Trigger Warning
In the case of an successful measurement, each recorded excitation results in green bars for all sensors as well as the excitation hammer. In the figure below, the first excitation hit ① had a double peak which surpassed the defined threshold in regards to the trigger level and thus shows a pink color with an exclamation mark in the bar. This is also displayed in the excitation group ② with a pink color for all three events. If a measurement exceeds the previously defined limits for the sensor range, a warning in the form of an orange bar is displayed shown in ③ for the excitation and the X+ response. If the measurement range of the channel is exceeded, the bar will turn red instead.
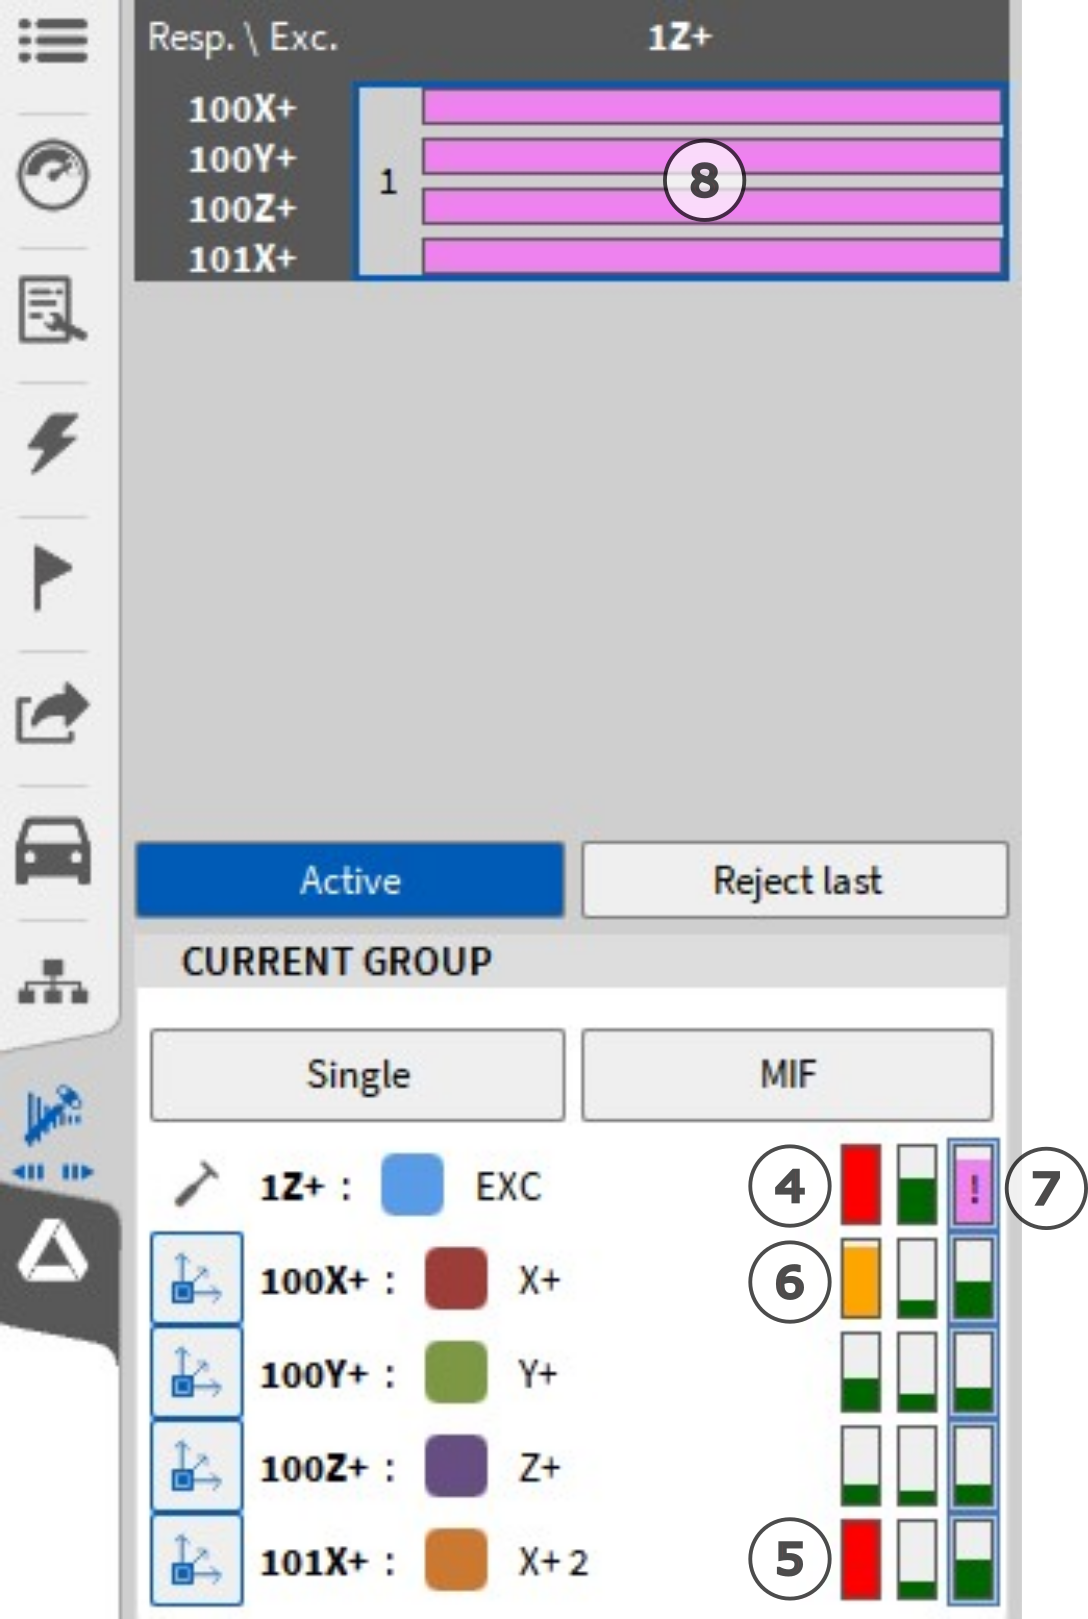
Fig. 29 Warnings
④ Exceeding of measurement range for excitation channel. ⑤ Exceeding of measurement range for the X+2 response channel. ⑥ Exceeding of the defined measurement range (Trigger & FRF tab). ⑦ Double hit excitation warning. ⑧ Double hit warning, marked for whole measurement group.
Recording and exporting data
When a recording is started, all previously collected data is discarded. While a recording is paused, no data is saved, even though a trigger event can be recognized. Keep this in mind when pausing a recording while changing the excitation point, for example.
To export data, save a recording and open the *.dmd file. Then switch to the export settings in the Menu Bar on the right of the start screen. The default export format is *.uff (universal file format), but a variety of other data types are available.
Attention
Only single-value vector channeles can be exported. This means only the MIF, Coherence, and FRF AVG channels can be exported!
For further information, please refer to the latest OXYGEN manual available in our Customer Care Center .